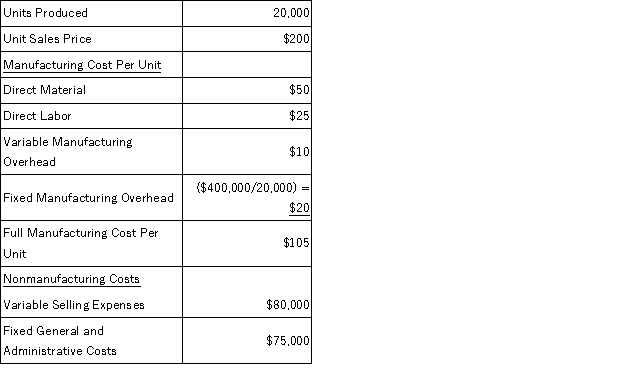
A) $1,400,000
B) $1,460,000
C) $1,745,000
D) $1,785,000
F) All of the above
Correct Answer

verified
Correct Answer
verified
Multiple Choice
Cardinal uses the high-low method of estimating costs. Cardinal had total costs of $25,000 at its lowest level of activity, when 5,000 units were sold. When, at its highest level of activity, sales equaled 10,000 units, total costs were $39,000. Cardinal would estimate variable cost per unit as:
A) $7.00
B) $4.55
C) $2.80
D) $5.26
F) A) and C)
Correct Answer

verified
Correct Answer
verified
Multiple Choice
Fremont, which uses the high-low method, reported total costs of $10 per unit at its lowest production level, 5,000 units. When production tripled to its highest level, the total cost per unit dropped to $5. Fremont would estimate its total fixed cost as:
A) $5
B) $15
C) 50,000
D) $37,500
F) B) and C)
Correct Answer

verified
Correct Answer
verified
Multiple Choice
The contribution margin ratio is:
A) the contribution margin stated as a percentage of sales.
B) the contribution margin stated as a percentage of profit.
C) the contribution margin stated as a percentage of total costs.
D) the contribution margin stated as a percentage of fixed costs.
F) None of the above
Correct Answer

verified
Correct Answer
verified
Multiple Choice
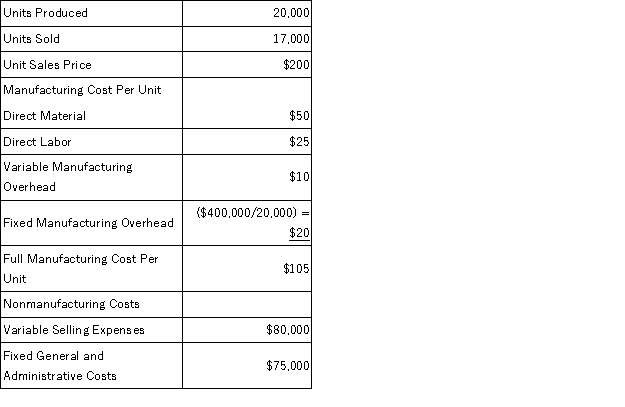
Jasper Enterprises had the following cost and production information for April:  What is Jasper Enterprise's income under variable costing?
A) $1,400,000
B) $1,460,000
C) $1,745,000
D) $1,785,000
F) None of the above
Correct Answer

verified
Correct Answer
verified
Multiple Choice
All else being equal, if sales revenue doubles, fixed costs will:
A) decrease in total.
B) increase in total.
C) decrease on a per unit basis.
D) increase on a per unit basis.
F) A) and B)
Correct Answer

verified
Correct Answer
verified
True/False
R-square tells managers how much of the variability in activity is caused by variability in cost
B) False
Correct Answer

verified
Correct Answer
verified
Multiple Choice
Citrus, Inc. used the high-low method to estimate that its fixed costs are $210,000. At its low level of activity, 100,000 units, average cost was $2.60 per unit. What would Citrus predict its average cost per unit to be when production is 200,000 units?
A) $1.05
B) $1.55
C) $2.60
D) $5.20
F) B) and C)
Correct Answer

verified
Correct Answer
verified
True/False
The contribution margin income statement is appropriate for external users
B) False
Correct Answer

verified
Correct Answer
verified
Multiple Choice
If the number of units sold is the same every month, the profit from these units will be the same every month if:
A) absorption costing is used.
B) variable costing is used.
C) production is greater than sales.
D) sales is greater than production.
F) B) and D)
Correct Answer

verified
Correct Answer
verified
Multiple Choice
Fremont, which uses the high-low method, reported total costs of $10 per unit at its lowest production level, 5,000 units. When production tripled to its highest level, the total cost per unit dropped to $5. Fremont would estimate its variable cost per unit as:
A) $2.50
B) $5.00
C) $15.00
D) ($5.00)
F) A) and C)
Correct Answer

verified
Correct Answer
verified
Multiple Choice
Using the results of the least-squares regression analysis, which value estimates total fixed costs?
A) R Square
B) Intercept
C) X Value
D) Multiple R
F) C) and D)
Correct Answer

verified
Correct Answer
verified
Multiple Choice
Sugar Corp. has a selling price of $20, variable costs of $12 per unit, and fixed costs of $25,000. Maple expects profit of $300,000 at its anticipated level of production. If Sugar sells 5,000 units more than expected, how much higher will its profits be?
A) $40,000
B) $100,000
C) $60,000
D) $300,000
F) A) and D)
Correct Answer

verified
Correct Answer
verified
Multiple Choice
The high-low method is a cost estimating approach that uses _______________ to find the cost line.
A) only two data points
B) all available data points
C) only four data points
D) personal intuition
F) C) and D)
Correct Answer

verified
Correct Answer
verified
True/False
The least-squares regression method uses all of the available data to find the best fitting line
B) False
Correct Answer

verified
Correct Answer
verified
Multiple Choice
Which of the following is true about the visual fit method?
A) The visual fit method is the most objective way to fit a line to cost data using a scattergraph.
B) Although a scattergraph can be created by hand, the visual fit method of determining total fixed costs and variable costs per unit must be completed by computer.
C) Assuming the relationship between total cost and activity is (mostly) linear the visual fit method is an approximation of total fixed costs and variable costs per unit.
D) If the scattergraph shows there is not a linear relationship between total costs and activity, the visual fit method can give a close approximation of total fixed costs and variable costs per unit.
F) All of the above
Correct Answer

verified
Correct Answer
verified
Multiple Choice
Flint Enterprises had the following cost and production information for April:  Inventory increased by 3,000 units during April. How much greater will Flint Enterprises' income be under absorption costing than under variable costing?
A) $60,000
B) $315,000
C) $340,000
D) $400,000
F) All of the above
Correct Answer

verified
Correct Answer
verified
Multiple Choice
We generally need ___________ data points to get reliable regression results using the least-squares regression method.
A) at least 20
B) six to eight
C) as many as possible
D) only two
F) A) and B)
Correct Answer

verified
Correct Answer
verified
Multiple Choice
All else being equal, if sales revenue doubles, variable costs will:
A) decrease in total.
B) increase in total.
C) decrease on a per unit basis.
D) increase on a per unit basis.
F) A) and C)
Correct Answer

verified
Correct Answer
verified
Multiple Choice
Which of the following statements is correct about the high-low method?
A) The high-low method is complicated to apply.
B) The high-low method is effective for periods in which activity is particularly high or low.
C) Generally, managers can obtain more accurate information from other methods of cost analysis that use a larger number of data points.
D) Generally, managers use the high-low method because it has no drawbacks or limitations.
F) A) and C)
Correct Answer

verified
Correct Answer
verified
Showing 21 - 40 of 127
Related Exams