A) the wealth or real balances effect is irrelevant to both models.
B) a change in the price level will have no impact on the aggregate expenditures schedule.
C) an increase (decrease) in the price level shifts the aggregate expenditures schedule upward (downward) .
D) an increase (decrease) in the price level shifts the aggregate expenditures schedule downward (upward) .
F) A) and C)
Correct Answer

verified
Correct Answer
verified
Multiple Choice
Cost-push inflation occurs because of a:
A) rightward shift in the aggregate demand curve.
B) leftward shift in the aggregate demand curve.
C) rightward shift in the aggregate supply curve.
D) leftward shift in the aggregate supply curve.
F) B) and D)
Correct Answer

verified
Correct Answer
verified
Multiple Choice
An economy is employing 2 units of capital, 5 units of raw materials, and 8 units of labour to produce its total output of 640 units.Each unit of capital costs $10, each unit of raw materials, $4, and each unit of labour, $3.Refer to the above information.If the per unit price of raw materials rises from $4 to $8 and all else remains constant, the per unit cost of production will rise by about:
A) 100 percent.
B) 50 percent.
C) 40 percent.
D) 30 percent.
F) None of the above
Correct Answer

verified
Correct Answer
verified
Multiple Choice
Other things equal, if world oil prices increased by 70 percent then the most likely effect would be to:
A) shift the aggregate demand curve right.
B) shift the aggregate supply curve right.
C) shift the aggregate supply curve left.
D) shift the aggregate demand curve right and the aggregate supply curve left.
F) B) and D)
Correct Answer

verified
Correct Answer
verified
Multiple Choice
The interest-rate effect suggests that:
A) a decrease in the supply of money will increase interest rates and reduce interest-sensitive consumption and investment spending.
B) an increase in the price level will increase the demand for money, reduce interest rates, and decrease consumption and investment spending.
C) an increase in the price level will increase the demand for money, increase interest rates, and decrease consumption and investment spending.
D) an increase in the price level will decrease the demand for money, reduce interest rates, and increase consumption and investment spending.
F) B) and C)
Correct Answer

verified
Correct Answer
verified
Multiple Choice
An increase in the GDP price level will:
A) decrease aggregate demand.
B) increase the quantity of real domestic output demanded.
C) increase aggregate demand.
D) decrease the quantity of real domestic output demanded.
F) All of the above
Correct Answer

verified
Correct Answer
verified
Multiple Choice
The shape of the aggregate demand curve is explained by the:
A) interest rate, real balances, and foreign trade effects.
B) rate of inflation and the natural rate of unemployment.
C) policies to stabilize prices and reduce unemployment.
D) ratchet effect.
F) C) and D)
Correct Answer

verified
Correct Answer
verified
Multiple Choice
Refer to the diagram below.Other things equal, a shift of the aggregate supply curve from AS0 to AS1 might be caused by a(n) : 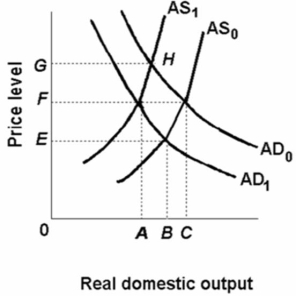
A) increase in government regulation.
B) increase in aggregate demand.
C) increase in productivity.
D) decline in nominal wages.
F) A) and D)
Correct Answer

verified
Correct Answer
verified
Multiple Choice
The Canadian economy was able to achieve full employment with relative price level stability in the early 2000 because aggregate:
A) demand increased.
B) supply decreased.
C) demand increased and aggregate supply increased.
D) demand decreased and aggregate supply increased.
F) None of the above
Correct Answer

verified
Correct Answer
verified
Multiple Choice
An increase in taxes will cause a(n) :
A) decrease in the quantity of real domestic output demanded.
B) increase in the quantity of real domestic output demanded.
C) decrease in aggregate demand.
D) increase in aggregate demand.
F) All of the above
Correct Answer

verified
Correct Answer
verified
Multiple Choice
In terms of aggregate supply, the difference between the long run and the short run is that in the long run:
A) the price level is variable.
B) employment is variable.
C) real output is variable.
D) nominal wages and other input prices are variable.
F) All of the above
Correct Answer

verified
Correct Answer
verified
Multiple Choice
Cost-push inflation arises from:
A) a decrease in aggregate demand.
B) a decrease in aggregate supply.
C) an increase in aggregate demand.
D) an increase in aggregate supply.
F) All of the above
Correct Answer

verified
Correct Answer
verified
Multiple Choice
Refer to the diagram given below.There are two panels in the diagram. 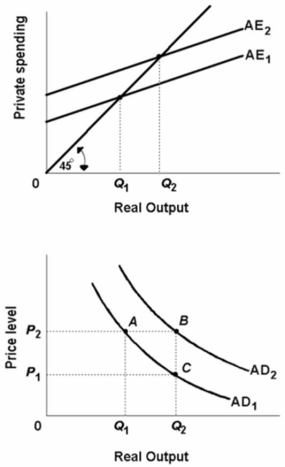 Assuming a constant price level, an increase in the aggregate expenditures schedule from AE1 to AE2 would:
A) Refer to the above diagrams.Assuming a constant price level, an increase in aggregate expenditures from AE1 to AE2 would:
B) move the economy from B to A along AD1.
C) shift the aggregate demand curve rightward from AD1 to AD2.
D) shift the aggregate demand curve from AD2 to AD1.
F) All of the above
Correct Answer

verified
Correct Answer
verified
Multiple Choice
Which would increase aggregate supply?
A) an increase in business regulation
B) a decline in productivity
C) an increase in business subsidies
D) a decrease in the capital stock
F) A) and B)
Correct Answer

verified
Correct Answer
verified
Multiple Choice
Income and substitution effects what portions, if any, of aggregate supply and/or aggregate demand?
A) Aggregate demand and aggregate supply
B) Aggregate demand only
C) Aggregate supply only
D) Neither
F) C) and D)
Correct Answer

verified
Correct Answer
verified
Multiple Choice
Refer to the diagram given below. 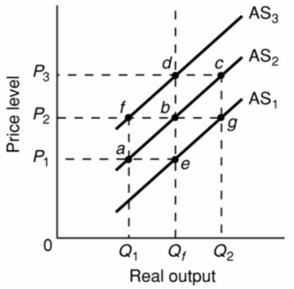 Assume that the nominal wages of workers in an economy are initially set on the basis of the price level P2 and that the economy is initially operating at the full-employment level of output Qf.In the short run, an increase in the price level from P2 to P3 will:
A) shift the aggregate supply curve from AS2 to AS3.
B) increase the real output from Q1 to Q2.
C) shift the aggregate supply curve from AS2 to AS1.
D) increase the real output from Qf to Q2.
F) B) and D)
Correct Answer

verified
Correct Answer
verified
Multiple Choice
In the late 1990s and early 2000s:
A) both AD and AS increased
B) inflation was relatively high.
C) AD increased but AS decreased.
D) AD decreased but AS increased.
F) C) and D)
Correct Answer

verified
Correct Answer
verified
Multiple Choice
The following table is for a particular country in which C is consumption expenditures, Ig is gross investment expenditures, G is government expenditures, X is exports, and M is imports.All figures are in billions of dollars.Each question is independent of the other questions.  Refer to the above table.The wealth or real balances effect of changes in the price level is:
A) shown by columns (1) and (2) of the table.
B) shown by columns (1) and (5) of the table.
C) shown by columns (1) and (4) of the table.
D) not shown by the data in the table.
F) None of the above
Correct Answer

verified
Correct Answer
verified
Multiple Choice
Refer to the diagram given below. 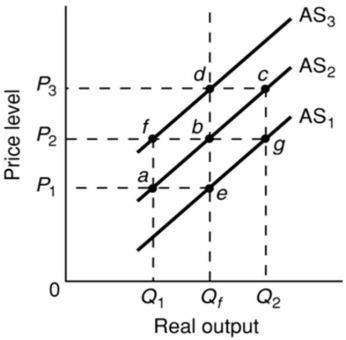 Assume that the nominal wages of workers are initially set on the basis of the price level P2 and that the economy is initially operating at the full-employment level of output Qf.In the short run, demand-pull inflation could best be shown as:
A) a movement from point b to point c on AS2.
B) a movement from point b to point d.
C) a shift of the aggregate supply curve from AS2 to AS3.
D) a shift of the aggregate supply curve from AS1 to AS2.
F) None of the above
Correct Answer

verified
Correct Answer
verified
Multiple Choice
Refer to the figure given below. 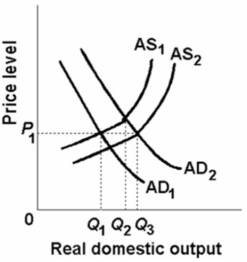 In the above figure, AD1 and AS1 represent the original aggregate demand and aggregate supply curves, respectively.AD2 and AS2 show the new aggregate demand and aggregate supply curves.The change in aggregate supply from AS1 to AS2 could be caused by:
A) a reduction in the price level.
B) an increased availability of entrepreneurial talent.
C) an increase in business taxes.
D) the real-balances effect, interest-rate effect, and foreign-trade effect.
F) A) and B)
Correct Answer

verified
Correct Answer
verified
Showing 181 - 200 of 203
Related Exams