A) The tax creates a shortage, and rationing must occur.
B) The tax creates excess supply and the government must buy the excess.
C) The tax creates a shortage, and the government must regulate the market.
D) None of these are correct.
F) A) and D)
Correct Answer

verified
Correct Answer
verified
Multiple Choice
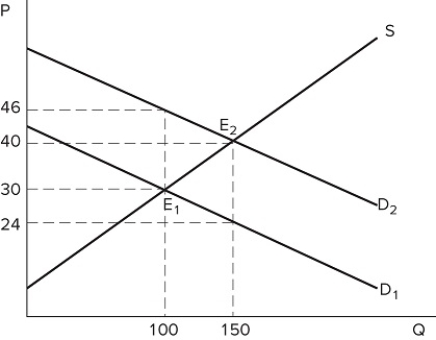 The graph shown portrays a subsidy to buyers. Before the subsidy is put in place, buyers bought _______ units and paid _______ for each one.
A) 100; $46
B) 100; $30
C) 150; $40
D) 150; $24
F) A) and B)
Correct Answer

verified
Correct Answer
verified
Multiple Choice
The incidence of a tax depends on:
A) the relative elasticity of the supply and demand curves in a market.
B) whether it is imposed on buyers or sellers.
C) the amount of revenue it generates once administrative burdens are taken into account.
D) whether the revenue it generates is greater than the deadweight loss it causes.
F) A) and C)
Correct Answer

verified
Correct Answer
verified
Multiple Choice
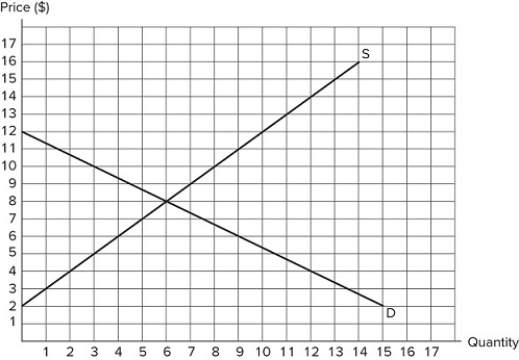 Suppose a $5 subsidy to buyers is imposed on the market in the graph shown. After the subsidy is in place, the post-subsidy price paid by buyers is _______ and the post-subsidy price received by sellers is _______.
A) $6; $11
B) $13; $8
C) $11; $6
D) $3; $8
F) A) and C)
Correct Answer

verified
Correct Answer
verified
Multiple Choice
Which of the following is an unintended consequence of price ceilings?
A) The loss of surplus always outweighs the benefits of the policy.
B) Non-price rationing must occur and can lead to bribes.
C) The transfer of surplus from producer to consumer rarely is recognized.
D) Producers will increase the quality of the goods sold.
F) A) and D)
Correct Answer

verified
Correct Answer
verified
Multiple Choice
 According to the market in the graph shown, at which of the following prices could a binding price floor be set?
A) $10
B) $6
C) $8
D) A binding price floor could not be set at any of these prices.
F) A) and B)
Correct Answer

verified
Correct Answer
verified
Multiple Choice
A tax on sellers shifts the ______ by the amount of the tax.
A) supply curve left
B) demand curve left
C) supply curve up
D) demand curve down
F) B) and C)
Correct Answer

verified
Correct Answer
verified
Multiple Choice
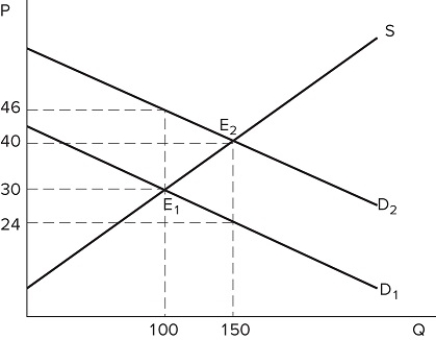 The graph shown portrays a subsidy to buyers. With the subsidy, sellers sell _______ units, and the post-subsidy price received for each one is _______.
A) 100; $46
B) 100; $30
C) 150; $40
D) 150; $24
F) A) and B)
Correct Answer

verified
Correct Answer
verified
Multiple Choice
In general, price controls have a _______ effect in the _______ than in the _______ because demand and supply become _______ elastic over time.
A) larger; long run; short run; more
B) larger; short run; long run; more
C) smaller; long run; short run; less
D) smaller; short run; long run; less
F) A) and D)
Correct Answer

verified
Correct Answer
verified
Multiple Choice
Is it possible for sellers to benefit more than buyers from a subsidy to buyers?
A) Yes, if the sellers need it more.
B) Yes, if the supply curve is relatively less elastic than the demand curve.
C) Yes, if the supply curve is relatively more elastic than the demand curve.
D) No; sellers can never benefit more than buyers from a subsidy to buyers.
F) C) and D)
Correct Answer

verified
Correct Answer
verified
Multiple Choice
Government attempts to set prices below market equilibrium can:
A) lead to more producer surplus.
B) encourage more production.
C) reduce the total surplus in the market.
D) always create a better outcome.
F) A) and B)
Correct Answer

verified
Correct Answer
verified
Multiple Choice
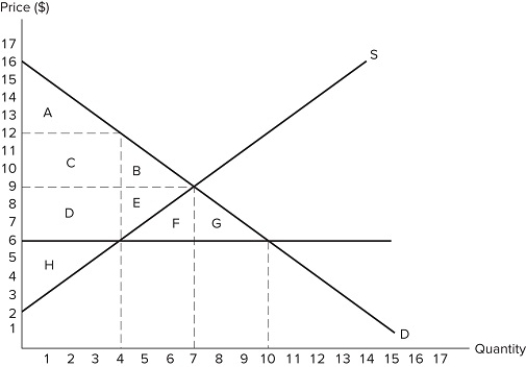 If the intended aim of the price ceiling set at $6, as shown in the graph, was a net increase in the well-being of consumers, then positive analysis would conclude that the policy was:
A) effective because areas A + C are larger than areas B + D.
B) effective because area B is smaller than area D.
C) ineffective because area D is larger than area E.
D) ineffective because areas A + C + D are larger than areas B + E.
F) A) and D)
Correct Answer

verified
Correct Answer
verified
Multiple Choice
Government attempts to lower, raise, or simply stabilize prices will usually:
A) maintain the distribution of surplus.
B) create unintended side effects.
C) improve the efficiency of a market.
D) All of these are correct.
F) A) and B)
Correct Answer

verified
Correct Answer
verified
Multiple Choice
When a tax is imposed on a market:
A) the price the buyer pays is higher than the amount the seller receives.
B) the buyers' equilibrium tax-inclusive price increases and the equilibrium quantity decreases.
C) fewer total transactions take place in the market.
D) All of these are correct.
F) A) and B)
Correct Answer

verified
Correct Answer
verified
Multiple Choice
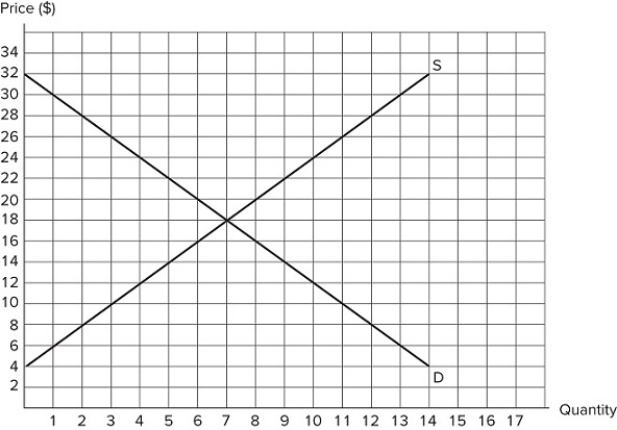 If a price ceiling of $14 is set in the market shown in the graph: QS appears to be incomplete.I. Total surplus will be $90.II. Deadweight loss will be $8.III. Producer surplus will be $25.
A) I only
B) III only
C) II and III only
D) I, II, and III
F) All of the above
Correct Answer

verified
Correct Answer
verified
Multiple Choice
In order for a price ceiling to be binding, it must be set _______ the equilibrium price, and it will likely cause _______.
A) above; a shortage
B) below; a shortage
C) above; excess supply
D) below; excess supply
F) None of the above
Correct Answer

verified
Correct Answer
verified
Multiple Choice
How can a government ensure all producers benefit from the implementation of a price floor?
A) Guarantee to buy all excess supply
B) Ration a certain quantity per consumer
C) Ration a certain quantity per producer
D) All of these are correct.
F) A) and C)
Correct Answer

verified
Correct Answer
verified
Multiple Choice
Because a price ceiling causes:
A) a shortage, some form of rationing must occur.
B) excess supply, some form of rationing must occur.
C) a shortage, the outcome will be efficient.
D) excess supply, the outcome will be inefficient.
F) B) and D)
Correct Answer

verified
Correct Answer
verified
Multiple Choice
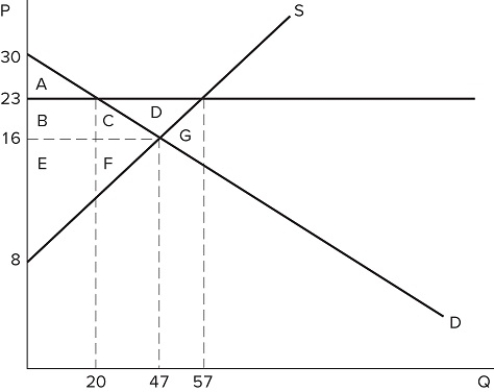 If the intended aim of the price floor set at $23, as shown in the graph, was a net increase in the well-being of producers, then positive analysis would have us consider whether:
A) the surplus transferred from producers to consumers is greater than the consumer surplus lost due to fewer transactions taking place.
B) the surplus transferred from consumers to producers is greater than the consumer surplus lost due to fewer transactions taking place.
C) the producer surplus lost due to fewer transactions taking place is greater than the producer surplus gained from a higher price.
D) the producer surplus lost due to lower prices is greater than the producer surplus lost due to fewer transactions taking place.
F) None of the above
Correct Answer

verified
Correct Answer
verified
Multiple Choice
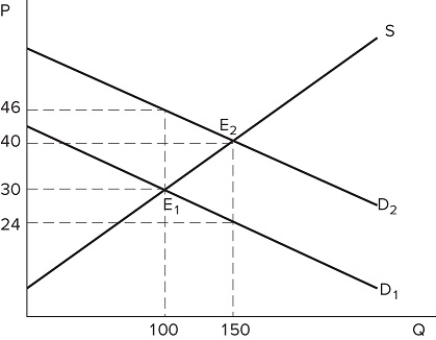 The graph shown portrays a subsidy to buyers. The subsidy causes _______ units to be sold in this market.
A) 50 more
B) 150 more
C) 100 fewer
D) 50 fewer
F) A) and D)
Correct Answer

verified
Correct Answer
verified
Showing 21 - 40 of 171
Related Exams