A) Yes; the demand curve shifts up by the amount of the subsidy.
B) Yes; the demand curve shifts to the right by the amount of the subsidy.
C) No; the demand curve does not move, as quantity demanded increases instead.
D) No; the demand curve does not move, as quantity demanded decreases instead.
F) A) and B)
Correct Answer

verified
Correct Answer
verified
Multiple Choice
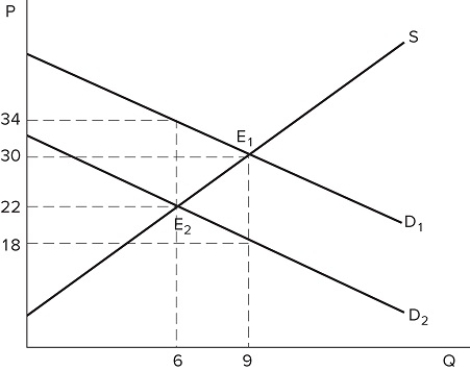 Consider the graph shown. What would most likely be the cause of a shift from D1 to D2?
A) A tax on sellers
B) A tax on buyers
C) A subsidy for sellers
D) A subsidy for buyers
F) A) and C)
Correct Answer

verified
Correct Answer
verified
Multiple Choice
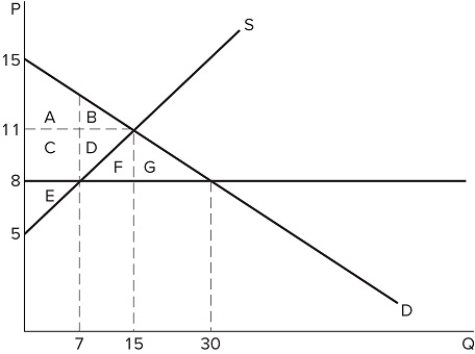 The graph shown best represents:
A) a binding price ceiling.
B) a binding price floor.
C) a missing market.
D) a market for an inferior good.
F) C) and D)
Correct Answer

verified
Correct Answer
verified
Multiple Choice
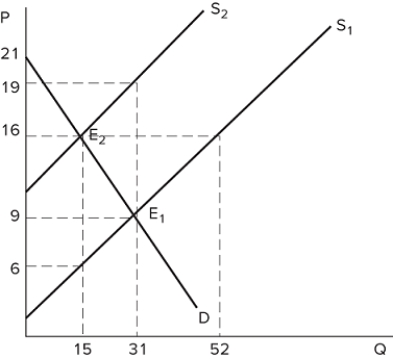 The graph shown demonstrates a tax on sellers. Before the tax was imposed, the buyers purchased _______ units and paid _______ for each one.
A) 15; $16
B) 15; $6
C) 31; $9
D) 31; $19
F) B) and D)
Correct Answer

verified
Correct Answer
verified
Multiple Choice
Governments can discourage the consumption of certain goods by:
A) giving a subsidy to consumers in those markets.
B) taxing substitute goods.
C) imposing a minimum price above the equilibrium price.
D) None of these policies decrease the consumption of goods.
F) All of the above
Correct Answer

verified
Correct Answer
verified
Multiple Choice
A subsidy:
A) is a requirement that the government pay an extra amount to producers or consumers of a good.
B) is used by governments to encourage the production and consumption of a particular good or service.
C) is used by governments as an alternative to price controls to benefit certain groups without generating a shortage or excess supply.
D) All of these statements are true.
F) B) and D)
Correct Answer

verified
Correct Answer
verified
Multiple Choice
If sellers bear a smaller tax burden than buyers in a market, which of the following must be true?
A) It must be a market for inferior goods.
B) It must be a market for luxury items.
C) The supply curve must be more elastic than the demand curve.
D) The supply curve must be less elastic than the buyers demand curve.
F) B) and D)
Correct Answer

verified
Correct Answer
verified
Multiple Choice
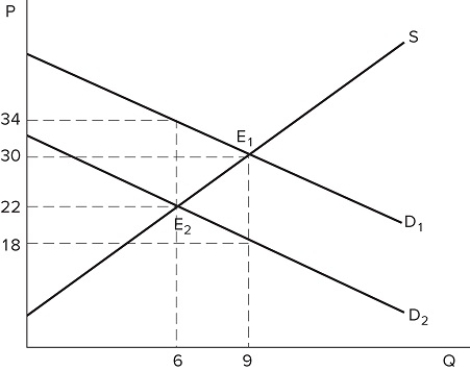 The graph shown demonstrates a tax on buyers. What is the amount of tax revenue being generated from the tax?
A) $72
B) $36
C) $48
D) $96
F) A) and C)
Correct Answer

verified
Correct Answer
verified
Multiple Choice
How can one allocate a good that is undersupplied due to a binding price ceiling?
A) Offer it on a first-come, first-served basis.
B) Ration a certain quantity per household.
C) Give the good to the friends and family of the producers.
D) All of these are correct.
F) A) and C)
Correct Answer

verified
Correct Answer
verified
Multiple Choice
 Suppose a $5 subsidy to buyers is imposed on the market in the graph shown. What is the cost to the government to fund this subsidy?
A) $45
B) $27
C) $90
D) $30
F) A) and B)
Correct Answer

verified
Correct Answer
verified
Multiple Choice
We would expect that a tax on cigarettes will be more effective at discouraging consumption over the _______ because demand becomes _______ elastic over time.
A) long run; more
B) long run; less
C) short run; more
D) short run; less
F) A) and C)
Correct Answer

verified
Correct Answer
verified
Multiple Choice
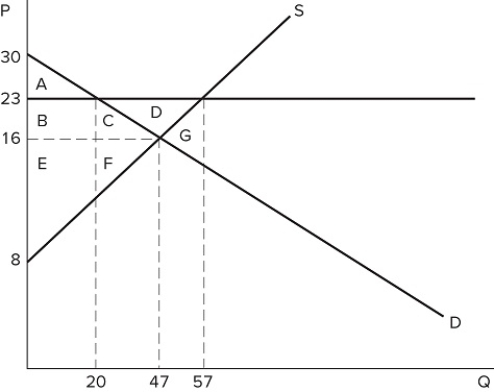 If a price floor is set at $23 in the market shown in the graph:
A) some consumers would lose because they will pay a higher price.
B) some producers would gain because they will sell at a higher price.
C) the quantity traded in the market would fall.
D) All of these are correct.
F) None of the above
Correct Answer

verified
Correct Answer
verified
Multiple Choice
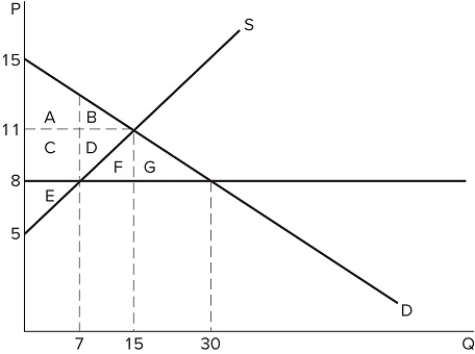 If a price ceiling is set at $8 in the market shown in the graph, which areas would represent total surplus?
A) A + B + C + D + E + F + G
B) A + B + C + D + E
C) A + C + E
D) A + B + C + D + E + F
F) A) and C)
Correct Answer

verified
Correct Answer
verified
Multiple Choice
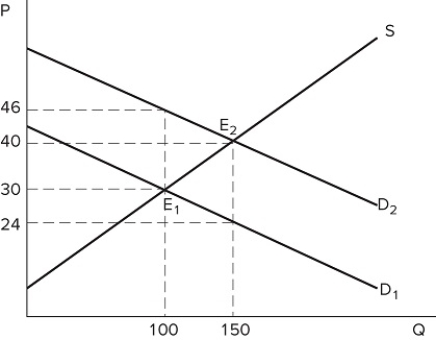 The graph shown portrays a subsidy to buyers. What is the deadweight loss that arises from this subsidy?
A) $400
B) $3,600
C) $750
D) $800
F) None of the above
Correct Answer

verified
Correct Answer
verified
Multiple Choice
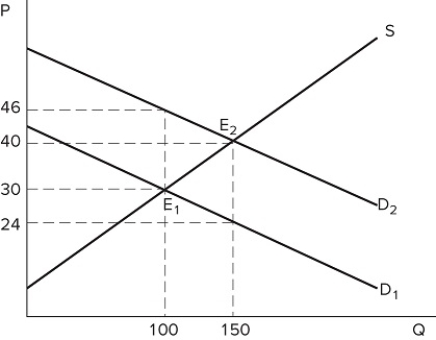 The graph shown portrays a subsidy to buyers. What is the amount of money the government has spent on this subsidy?
A) $3,600
B) $2,400
C) $6,000
D) $800
F) All of the above
Correct Answer

verified
Correct Answer
verified
Multiple Choice
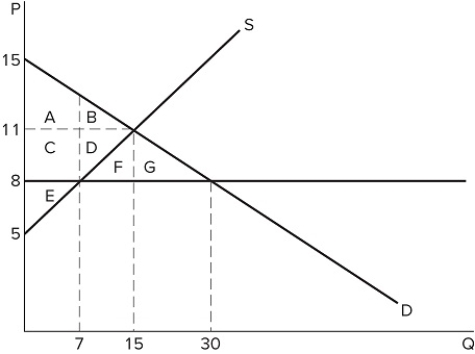 If a price ceiling is set at $8 in the market shown in the graph, which area(s) would represent producer surplus?
A) C + D + E
B) C + D + F + G
C) E
D) A + C + E
F) B) and D)
Correct Answer

verified
Correct Answer
verified
Multiple Choice
Positive analysis:
A) involves the formulation and testing of hypotheses.
B) involves value judgments concerning the desirability of alternative outcomes.
C) weighs the fairness of a policy.
D) examines if an outcome is desirable.
F) None of the above
Correct Answer

verified
Correct Answer
verified
Multiple Choice
What does tax incidence describe?
A) The difference between what buyers pay and what sellers receive in a market in which taxes are present
B) Whether buyers or sellers bear more of the relative burden of a tax
C) The revenue that is generated comes when taxes are imposed in markets
D) The difference between the revenue generated from a tax and the value of deadweight loss caused by the imposition of a tax.
F) C) and D)
Correct Answer

verified
Correct Answer
verified
Multiple Choice
A tax wedge:
A) refers to the difference in the price the buyer pays and the price the seller keeps.
B) refers to the shift in supply or demand that results from a tax.
C) only occurs in markets when the tax is placed on buyers.
D) only occurs in markets when taxes are placed on large corporations.
F) A) and C)
Correct Answer

verified
Correct Answer
verified
Multiple Choice
A price floor is:
A) a legal maximum price.
B) a legal minimum price.
C) a legal maximum quantity that can be sold at a particular price.
D) a legal minimum quantity that can be sold at a particular price.
F) A) and B)
Correct Answer

verified
Correct Answer
verified
Showing 141 - 160 of 171
Related Exams