A) the price of Snickers candy bars decreases.
B) a news story claims 95 percent of all geniuses eat at least one Snickers candy bar a day.
C) the price of Milky Way candy bars (a substitute) decreases.
D) the price of Milky Way candy bars (a substitute) increases.
F) B) and C)
Correct Answer

verified
Correct Answer
verified
Multiple Choice
An increase in the price of ice cream is likely to cause:
A) a movement to the left along the demand curve for ice cream.
B) an inward shift of the demand curve for ice cream.
C) an outward shift of the demand curve for ice cream.
D) a movement to the right along the demand curve for ice cream.
F) A) and D)
Correct Answer

verified
Correct Answer
verified
Multiple Choice
Suppose irregular weather patterns caused very poor yields for orange farmers this past year. Which factor of supply would this change in the market for orange juice?
A) Technology
B) Price of input
C) Number of sellers
D) Price of related good
F) B) and D)
Correct Answer

verified
Correct Answer
verified
Multiple Choice
Suppose the price of oil has recently increased, making it more expensive to manufacture ride-on lawn mowers. This oil price increase also makes it more expensive to run a ride-on mower. When the price of oil increases, the demand for ride-on mowers _____ and the supply of ride-on mowers _____.
A) increases; increases
B) decreases; decreases
C) increases; decreases
D) decreases; increases
F) A) and C)
Correct Answer

verified
Correct Answer
verified
Multiple Choice
Which of the following is not a non-price determinant of demand?
A) Consumer preferences
B) Income of the consumers
C) The number of sellers in the market
D) The prices of related goods
F) None of the above
Correct Answer

verified
Correct Answer
verified
Multiple Choice
How should you plot a supply curve on a coordinate system diagram?
A) Quantity goes on the horizontal axis and price goes on the vertical axis.
B) Quantity goes on the vertical axis and price goes on the horizontal axis.
C) Both quantity and price go on the horizontal axis.
D) It doesn't matter which axis price and quantity are placed on.
F) A) and B)
Correct Answer

verified
Correct Answer
verified
Multiple Choice
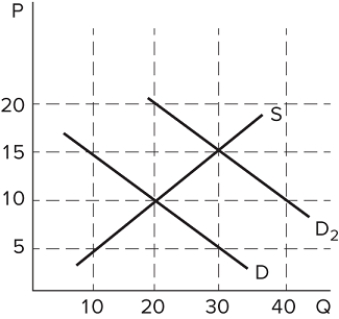
 Assume the graph shown represents the market for button-up shirts and was originally in equilibrium where demand (D) and supply (S) intersect. What type of shock might cause the demand curve to shift to D2?
A) An increase in the price of buttons
B) An increase in the price of ties
C) An increase in the price of sweatshirts
D) An increase in consumers' incomes
F) None of the above
Correct Answer

verified
Correct Answer
verified
Multiple Choice
What is likely to happen if a producer incorrectly sets the price of its product too high?
A) A shortage (excess demand) will result, and consumers will bid the price down to equilibrium.
B) A surplus (excess supply) will result, and the additional goods in inventory will prompt the producer to lower the price.
C) A shortage (excess demand) will result, and consumers will bid the price up to equilibrium.
D) A surplus (excess supply) will result, and the additional goods in inventory will prompt the producer to restrict output until sales increase.
F) A) and C)
Correct Answer

verified
Correct Answer
verified
Multiple Choice
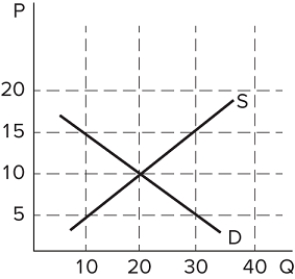
 The graph shown depicts the market for a good. What state is this market in if the price of the good is $5?
A) There is a shortage (excess demand) , signaling that sellers should leave the market.
B) There is a shortage (excess demand) , signaling that buyers should bid up the price.
C) There is a surplus (excess supply) , signaling that sellers should drop their price.
D) There is a surplus (excess supply) , signaling that buyers should bid up the price.
F) A) and B)
Correct Answer

verified
Correct Answer
verified
Multiple Choice
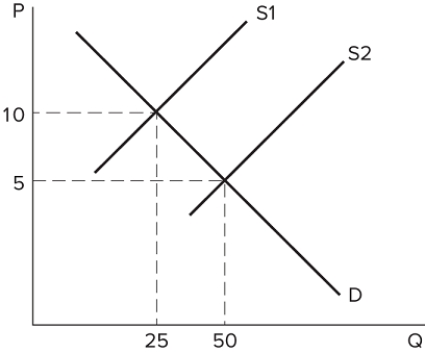
 The graph shown depicts the market for a good. Assume the market was originally in equilibrium where the demand curve (D) and supply curve (S2) intersect. Something changes in the market, and the supply curve shifts to S1. What could have caused this shift?
A) The price of pizza sauce increased.
B) The price of pizza decreased.
C) The price of labor for pizza shops decreased.
D) Consumers no longer prefer to eat pizza.
F) B) and D)
Correct Answer

verified
Correct Answer
verified
Showing 161 - 170 of 170
Related Exams