A) will cause quantity demanded to exceed quantity supplied.
B) will cause quantity supplied to exceed quantity demanded.
C) will increase total well-being.
D) will set a legal maximum price in a market.
F) B) and D)
Correct Answer

verified
Correct Answer
verified
Multiple Choice
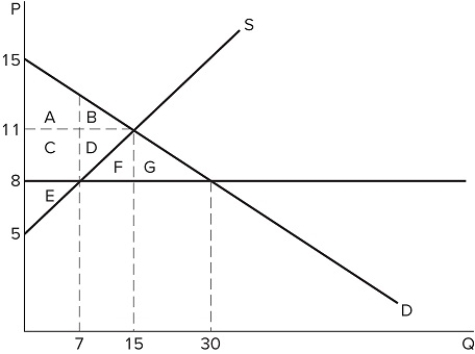 If a price ceiling is set at $8 in the market shown in the graph, which area(s) would represent producer surplus?
A) C + D + E
B) C + D + F + G
C) E
D) A + C + E
F) A) and C)
Correct Answer

verified
Correct Answer
verified
Multiple Choice
A tax imposed on a good can:
A) discourage consumption of the good.
B) encourage production of the good.
C) increase the supply of complementary goods.
D) lower prices paid by consumers.
F) All of the above
Correct Answer

verified
Correct Answer
verified
Multiple Choice
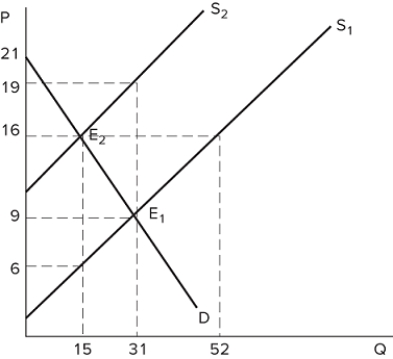 Consider the market shown in the graph. What would most likely be the cause of a shift from S1 to S2?
A) A tax on sellers
B) A tax on buyers
C) A subsidy for sellers
D) A subsidy for buyers
F) B) and C)
Correct Answer

verified
Correct Answer
verified
Multiple Choice
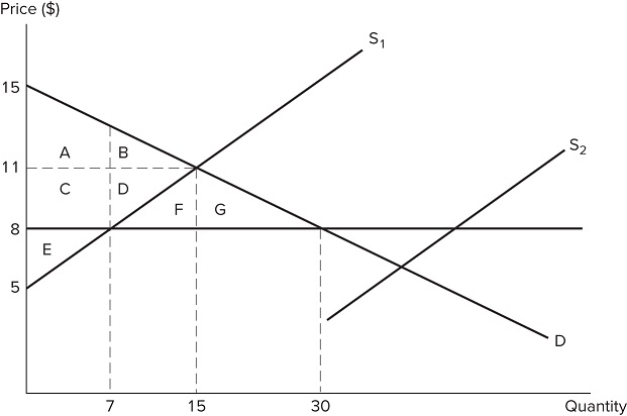 Suppose S1 represents the initial market supply in the graph shown. A price ceiling is then set at $8. If supply shifts from S1 to S2, what will occur?
A) The price ceiling will no longer be binding.
B) The price ceiling will prevent output from changing.
C) The size of the shortage will increase.
D) The market will not reach equilibrium.
F) A) and B)
Correct Answer

verified
Correct Answer
verified
Multiple Choice
Does a subsidy to buyers affect the supply curve?
A) Yes; the supply curve shifts up by the amount of the subsidy.
B) Yes; the supply curve shifts to the right by the amount of the subsidy.
C) No; the supply curve does not move, as quantity supplied increases instead.
D) No; the supply curve does not move, as quantity supplied decreases instead.
F) A) and B)
Correct Answer

verified
Correct Answer
verified
Multiple Choice
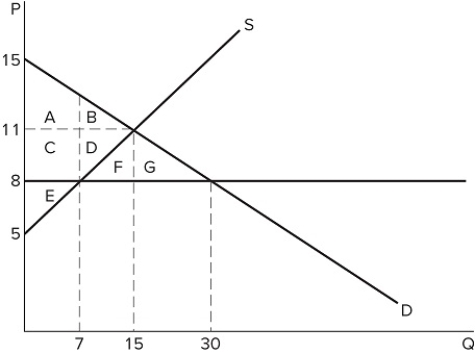 A price ceiling in the market shown in the graph would be non-binding if it were set at:
A) $5.
B) $8.
C) $10.
D) $13.
F) A) and D)
Correct Answer

verified
Correct Answer
verified
Multiple Choice
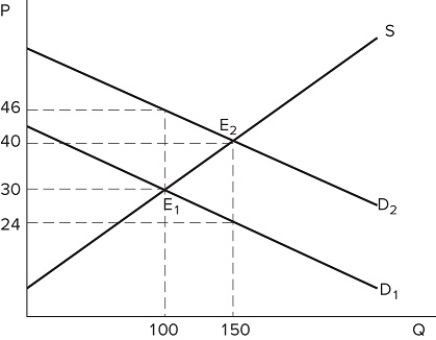 The graph shown portrays a subsidy to buyers. What is the amount of the subsidy per unit of this good?
A) $22
B) $16
C) $10
D) $6
F) B) and D)
Correct Answer

verified
Correct Answer
verified
Multiple Choice
Does a tax on sellers affect the supply curve?
A) Yes; the supply curve shifts to the left by the amount of the tax.
B) Yes; the supply curve shifts to the right by the amount of the tax.
C) Yes; the supply curve shifts up by the amount of the tax.
D) No; the supply curve does not move, as there is a change in the quantity supplied instead.
F) A) and C)
Correct Answer

verified
Correct Answer
verified
Multiple Choice
Which of the following statements about taxes is true?
A) They benefit many of the consumers in the market.
B) They are sometimes used to correct market failures.
C) They are sometimes used to transfer surplus from producers to consumers.
D) They are sometimes used to transfer surplus from consumers to producers.
F) B) and D)
Correct Answer

verified
Correct Answer
verified
Multiple Choice
 The graph shown demonstrates a tax on sellers. What is the amount of tax revenue being generated?
A) $150
B) $80
C) $310
D) $135
F) C) and D)
Correct Answer

verified
Correct Answer
verified
Multiple Choice
Who benefits from a subsidy to sellers?
A) Only buyers benefit.
B) Only sellers benefit.
C) The benefit is shared by sellers and buyers depending on the elasticity of the supply and demand curves.
D) None of these statements are true.
F) None of the above
Correct Answer

verified
Correct Answer
verified
Multiple Choice
A tax on sellers has what effect on a market?
A) Supply shifts vertically upward by the amount of the tax.
B) Demand shifts vertically downward by the amount of the tax.
C) Equilibrium price decreases and equilibrium quantity decreases.
D) Equilibrium price decreases and equilibrium quantity increases.
F) B) and C)
Correct Answer

verified
Correct Answer
verified
Multiple Choice
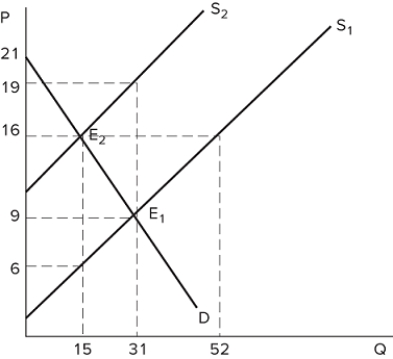 The graph shown demonstrates a tax on sellers. After the tax is in place, buyers purchase _______ units, and the post-tax price paid for each one is _______.
A) 15; $16
B) 15; $6
C) 31; $9
D) 31; $19
F) All of the above
Correct Answer

verified
Correct Answer
verified
Multiple Choice
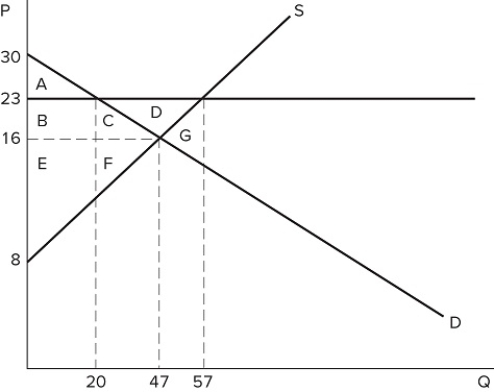 A price floor in the market shown in the graph would be non-binding if it were set at:
A) $30.
B) $23.
C) $16.
D) Any of these prices.
F) B) and D)
Correct Answer

verified
Correct Answer
verified
Multiple Choice
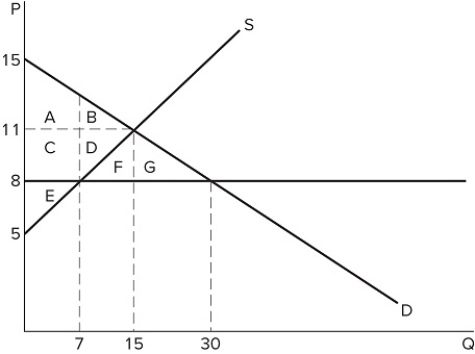 Which action could cause the price ceiling shown in the graph to become non-binding?
A) An increase in demand (shift to the right)
B) A decrease in demand (shift to the left)
C) A decrease in supply (shift to the left)
D) None of these would cause the price ceiling to become non-binding.
F) A) and C)
Correct Answer

verified
Correct Answer
verified
Multiple Choice
 If a price floor is set at $23 in the market shown in the graph, which areas would represent producer surplus?
A) B + C + D + F
B) B + E
C) B + C + D
D) B + C + E + F
F) B) and C)
Correct Answer

verified
Correct Answer
verified
Multiple Choice
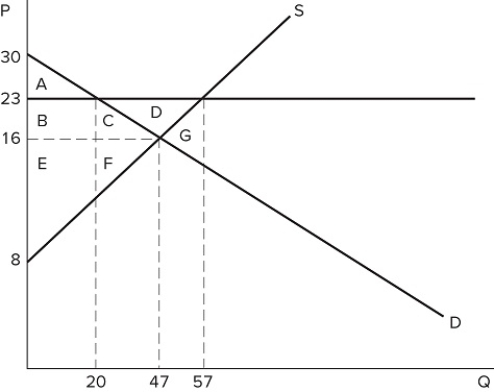 If a price floor is set at $23 in the market shown in the graph, which area(s) would represent deadweight loss?
A) C + F
B) C + D + F
C) G
D) B + C + E + F
F) A) and B)
Correct Answer

verified
Correct Answer
verified
Multiple Choice
The relative tax burden borne by buyers and sellers is called the:
A) tax wedge.
B) tax incidence.
C) tax revenue.
D) real tax.
F) A) and B)
Correct Answer

verified
Correct Answer
verified
Multiple Choice
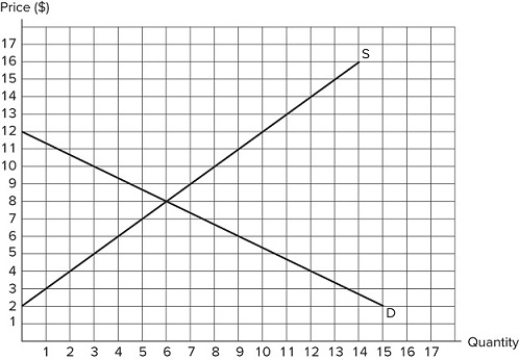 Suppose a $5 subsidy to buyers is imposed on the market in the graph shown. After the subsidy is in place, the post-subsidy price paid by buyers is _______ and the post-subsidy price received by sellers is _______.
A) $6; $11
B) $13; $8
C) $11; $6
D) $3; $8
F) A) and C)
Correct Answer

verified
Correct Answer
verified
Showing 121 - 140 of 170
Related Exams