A) A
B) A + B + C
C) H
D) H + D + E
F) A) and C)
Correct Answer

verified
Correct Answer
verified
Multiple Choice
The graph shown demonstrates the domestic demand and supply for a good, as well as the world price for that good. 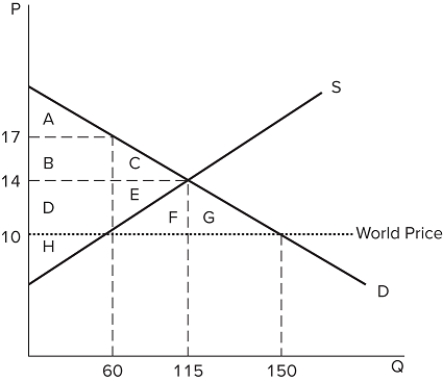 If this country is an autarky, what is the equilibrium price?
A) $10
B) $14
C) $17
D) $4
F) B) and C)
Correct Answer

verified
Correct Answer
verified
Multiple Choice
The graph shown demonstrates the domestic demand and supply for a good, as well as a tariff and the world price for that good. 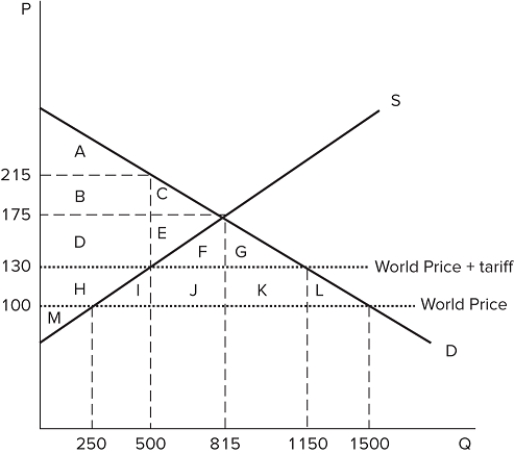 If the economy was previously in autarky, the decision to open to trade and impose a tariff will cause the economy to:
A) increase its output from 250 units to 500 units.
B) decrease its output from 815 units to 500 units.
C) increase its output from 500 units to 815 units.
D) decrease its output from 1,500 units to 1,150 units.
F) B) and D)
Correct Answer

verified
Correct Answer
verified
Multiple Choice
The graph shown demonstrates the domestic demand and supply for a good, as well as the world price for that good. 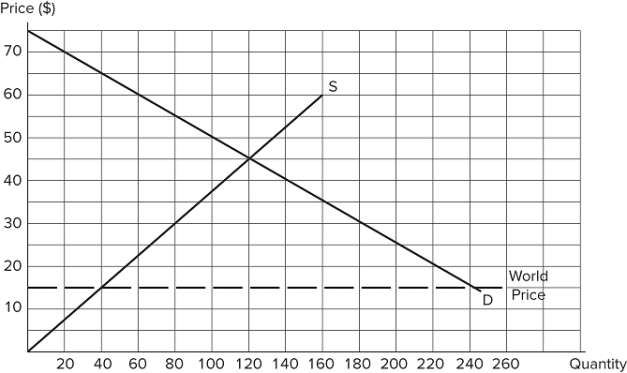 If this economy decides to impose a $15 per unit tariff, what will deadweight loss be?
A) $2,100
B) $3,000
C) $600
D) $250
F) C) and D)
Correct Answer

verified
Correct Answer
verified
Multiple Choice
The graph shown demonstrates the domestic demand and supply for a good, as well as a quota and the world price for that good. 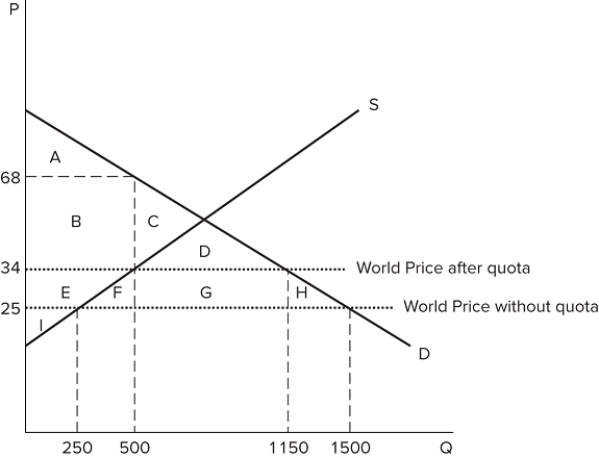 What amount of the good is bought by domestic consumers when there is open trade?
A) 1,500 units
B) 1,150 units
C) 500 units
D) 250 units
F) A) and B)
Correct Answer

verified
Correct Answer
verified
Multiple Choice
The graph shown demonstrates the domestic demand and supply for a good, as well as a tariff and the world price for that good. 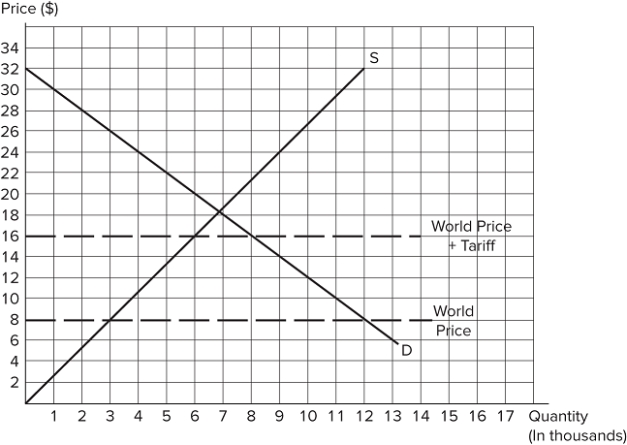 If this economy goes from free trade to imposing an $8 per unit tariff:total surplus will fall by $28,000.imports will fall by 7,000.producer surplus will increase by $36,000.
A) II only
B) I and II only
C) I and III only
D) I, II, and III
F) A) and C)
Correct Answer

verified
Correct Answer
verified
Multiple Choice
The graph shown demonstrates the domestic demand and supply for a good, as well as the world price for that good. 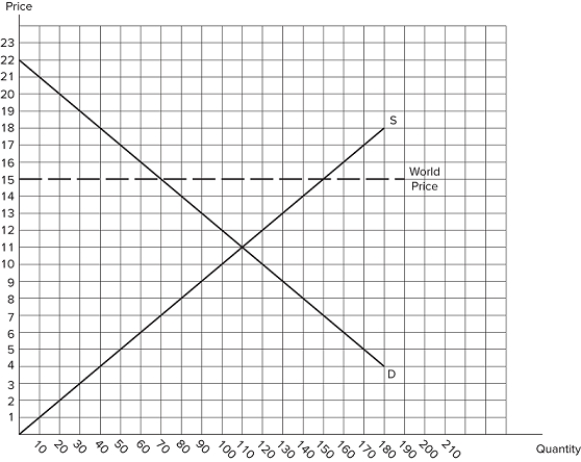 If this economy were to open to free trade:
A) consumer surplus would be $605.
B) total surplus would be $1,370.
C) producer surplus would be $605.
D) deadweight loss would be $160.
F) None of the above
Correct Answer

verified
Correct Answer
verified
Multiple Choice
The graph shown demonstrates the domestic demand and supply for a good, as well as the world price for that good. 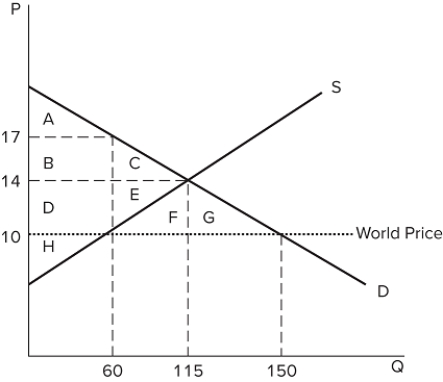 If this economy were open to free trade, how many units of the good would be produced domestically?
A) 115
B) 60
C) 150
D) 90
F) B) and C)
Correct Answer

verified
Correct Answer
verified
Multiple Choice
We might predict that Hawaii has a comparative advantage in the production of pineapples compared to Russia because Hawaii has:
A) a climate more suitable for growing pineapples.
B) more land available for growing pineapples.
C) more advanced farming technology.
D) less governmental oversight in the pineapple industry.
F) A) and B)
Correct Answer

verified
Correct Answer
verified
Multiple Choice
A country that produces and consumes a large amount of coffee comparatively has just entered the world market. If the country becomes a net-exporter of coffee, we would expect that the world _______ curve will shift to the _______ more than the world _______ curve.
A) supply; right; demand
B) supply; left; demand
C) demand; right; supply
D) demand; left; supply
F) All of the above
Correct Answer

verified
Correct Answer
verified
Multiple Choice
When two countries specialize and trade:
A) they both can enjoy more output than either country could produce on its own.
B) they can achieve consumption levels beyond their own production possibilities.
C) both countries can gain surplus.
D) All of these are true.
F) A) and C)
Correct Answer

verified
Correct Answer
verified
Multiple Choice
The graph shown demonstrates the domestic demand and supply for a good, as well as a tariff and the world price for that good. 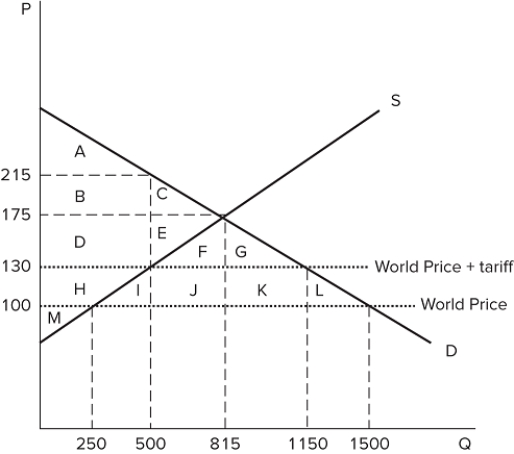 If this economy was previously open to free trade, the introduction of the tariff will cause government revenue to:
A) increase by areas J + K.
B) increase by areas F + G + J + K.
C) increase by areas I + J + K + L.
D) decrease by areas I + L.
F) None of the above
Correct Answer

verified
Correct Answer
verified
Multiple Choice
A preference for policies that place limits on trade is called:
A) liberalization.
B) free trade.
C) protectionism.
D) autarky.
F) None of the above
Correct Answer

verified
Correct Answer
verified
Multiple Choice
The graph shown demonstrates the domestic demand and supply for a good, as well as a tariff and the world price for that good. 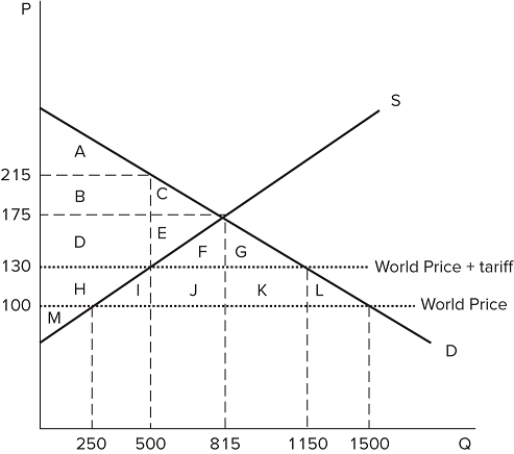 If this economy was previously open to free trade, the introduction of the tariff will cause producers to:
A) lose the surplus in areas H + I + J + K + L.
B) gain the surplus in areas H + I + J + K + L.
C) lose the surplus in area H.
D) gain the surplus in area H.
F) All of the above
Correct Answer

verified
Correct Answer
verified
Multiple Choice
A country with a lot of land relative to its population may have a comparative advantage in _______ activities.
A) capital-intensive
B) labor-intensive
C) land-intensive
D) technology-intensive
F) A) and C)
Correct Answer

verified
Correct Answer
verified
Multiple Choice
The graph shown demonstrates the domestic demand and supply for a good, as well as the world price for that good. 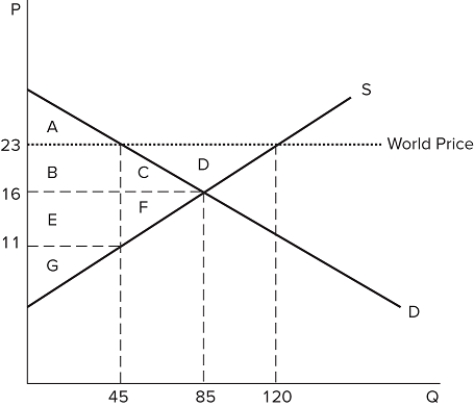 If this economy decides to open to free trade, how many units of the good will be produced domestically?
A) 45
B) 85
C) 120
D) 75
F) C) and D)
Correct Answer

verified
Correct Answer
verified
Multiple Choice
Which of the following is a common tool used to restrict trade through taxation?
A) Tariffs
B) Immigration restrictions
C) International waters use policies
D) Quotas
F) A) and C)
Correct Answer

verified
Correct Answer
verified
Multiple Choice
A country with plenty of capital and little land may have a comparative advantage in _______ activities.
A) land-intensive
B) capital-intensive
C) labor-intensive
D) technology-intensive
F) A) and D)
Correct Answer

verified
Correct Answer
verified
Multiple Choice
Which of the following is a common tool used to restrict trade through the quantity that can be traded?
A) Tariffs
B) Immigration restrictions
C) International waters use policies
D) Import quotas
F) B) and D)
Correct Answer

verified
Correct Answer
verified
Multiple Choice
The graph shown demonstrates the domestic demand and supply for a good, as well as a tariff and the world price for that good. 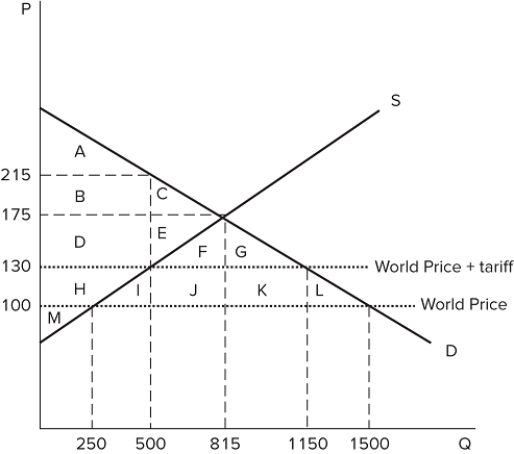 If the economy were to open to free trade, it would become:
A) a net importer.
B) a net exporter.
C) an autarky.
D) less efficient, with less overall market surplus.
F) A) and D)
Correct Answer

verified
Correct Answer
verified
Showing 61 - 80 of 149
Related Exams