A) MPS has increased.
B) MPC has increased.
C) income has increased.
D) income has decreased.
F) B) and D)
Correct Answer

verified
Correct Answer
verified
Multiple Choice
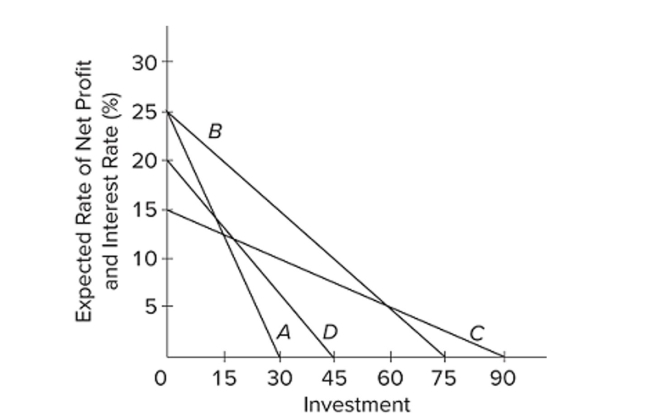 Refer to the diagram. Assume that for the entire business sector of a private closed economy there is $0 worth of investment projects that will yield an expected rate of return of 25 percent or more. But
There are $15 worth of investments that will yield an expected rate of return of 20-25 percent; another
$15 with an expected rate of return of 15-20 percent; and an additional $15 of investment projects in
Each successive rate of return range down to and including the 0-5 percent range. Which of the lines
On the diagram represents these data?
A) A
B) B
C) C
D) D
F) A) and C)
Correct Answer

verified
Correct Answer
verified
Multiple Choice
Other things equal, a decrease in the real interest rate will
A) shift the investment demand curve to the right.
B) shift the investment demand curve to the left.
C) move the economy upward along its existing investment demand curve.
D) move the economy downward along its existing investment demand curve.
F) C) and D)
Correct Answer

verified
Correct Answer
verified
Multiple Choice
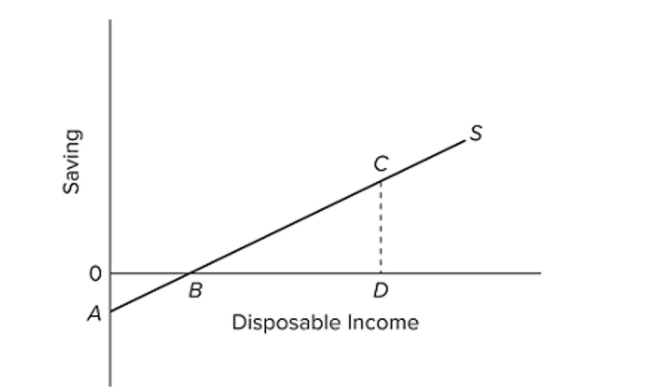 Refer to the diagram. At disposable income level D, consumption is equal to
A) CD.
B) D minus CD.
C) CD/D.
D) CD plus BD.
F) All of the above
Correct Answer

verified
Correct Answer
verified
Multiple Choice
Assume the economy's consumption and saving schedules simultaneously shift downward. This must be the result of
A) an increase in disposable income.
B) an increase in household wealth.
C) an increase in personal taxes.
D) the expectation of a recession.
F) All of the above
Correct Answer

verified
Correct Answer
verified
Multiple Choice
The MPC for an economy is
A) the slope of the consumption schedule or line.
B) the slope of the savings schedule or line.
C) 1 divided by the slope of the consumption schedule or line.
D) 1 divided by the slope of the savings schedule or line.
F) A) and D)
Correct Answer

verified
Correct Answer
verified
Multiple Choice
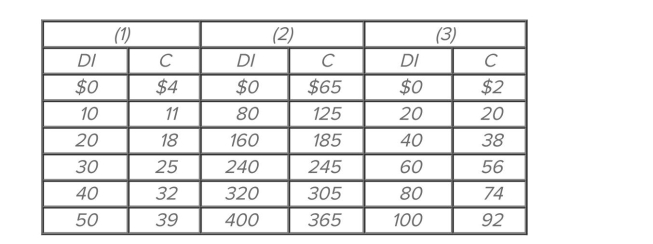 Refer to the given consumption schedules. DI signifies disposable income and C represents consumption expenditures. All figures are in billions of dollars. The marginal propensity to consume
A) is highest in economy (1) .
B) is highest in economy (2) .
C) is highest in economy (3) .
D) cannot be calculated from the data given.
F) B) and C)
Correct Answer

verified
Correct Answer
verified
Multiple Choice
A decline in the real interest rate will
A) increase the amount of investment spending.
B) shift the investment schedule downward.
C) shift the investment demand curve to the right.
D) shift the investment demand curve to the left.
F) B) and C)
Correct Answer

verified
Correct Answer
verified
Multiple Choice
When a consumption schedule is plotted as a straight line, the slope of the consumption line is
A) vertical.
B) horizontal.
C) greater than the slope of the 45° line.
D) less than the slope of the 45° line.
F) None of the above
Correct Answer

verified
Correct Answer
verified
Multiple Choice
(Last Word) Art Buchwald's article "Squaring the Economic Circle" is a humorous description of
A) a negative GDP gap.
B) a positive GDP gap.
C) the marginal propensity to save.
D) the multiplier.
F) B) and C)
Correct Answer

verified
Correct Answer
verified
Multiple Choice
If the consumption schedule is linear, then the
A) saving schedule will also be linear.
B) MPS will decline as income rises.
C) MPC will decline as income rises.
D) APC will be constant at all levels of income.
F) A) and D)
Correct Answer

verified
Correct Answer
verified
Multiple Choice
Assume that for the entire business sector of a private closed economy, there are $0 worth of investment projects that will yield an expected rate of return of 25 percent or more. But there are $15 Worth of investments that will yield an expected rate of return of 20-25 percent, another $15 with an Expected rate of return of 15-20 percent, and an additional $15 of investment projects in each Successive rate of return range down to and including the 0-5 percent range. If the real interest rate is 5 percent, what amount of investment will be undertaken?
A) $15
B) $30
C) $45
D) $60
F) A) and B)
Correct Answer

verified
Correct Answer
verified
Multiple Choice
Other things equal, a 10 percent decrease in corporate income taxes will
A) decrease the market price of real capital goods.
B) have no effect on the location of the investment demand curve.
C) shift the investment demand curve to the right.
D) shift the investment demand curve to the left.
F) C) and D)
Correct Answer

verified
Correct Answer
verified
Multiple Choice
As disposable income decreases, consumption
A) and saving both increase.
B) and saving both decrease.
C) increases and saving decreases.
D) decreases and saving increases.
F) C) and D)
Correct Answer

verified
Correct Answer
verified
Multiple Choice
If for some reason households become increasingly thrifty, we could show this by
A) a downshift of the saving schedule.
B) an upward shift of the consumption schedule.
C) an upward shift of the saving schedule.
D) a movement down along a stable consumption function.
F) A) and B)
Correct Answer

verified
Correct Answer
verified
Multiple Choice
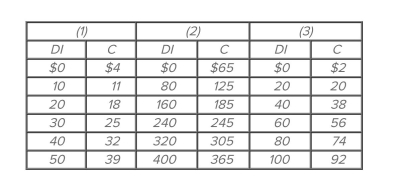 Refer to the given consumption schedules. DI signifies disposable income and C represents consumption expenditures. All figures are in billions of dollars. Suppose that consumption decreased
By $2 billion at each level of DI in each of the three countries. We can conclude that the
A) marginal propensity to consume will remain unchanged in each of the three countries.
B) marginal propensity to consume will decline in each of the three countries.
C) average propensity to save will fall at each level of DI in each of the three countries.
D) marginal propensity to save will rise in each of the three countries.
F) All of the above
Correct Answer

verified
Correct Answer
verified
Multiple Choice
The consumption schedule is such that
A) both the APC and the MPC increase as income rises.
B) the APC is constant and the MPC declines as income rises.
C) the MPC is constant and the APC declines as income rises.
D) the MPC and the APC must be equal at all levels of income.
F) B) and D)
Correct Answer

verified
Correct Answer
verified
Multiple Choice
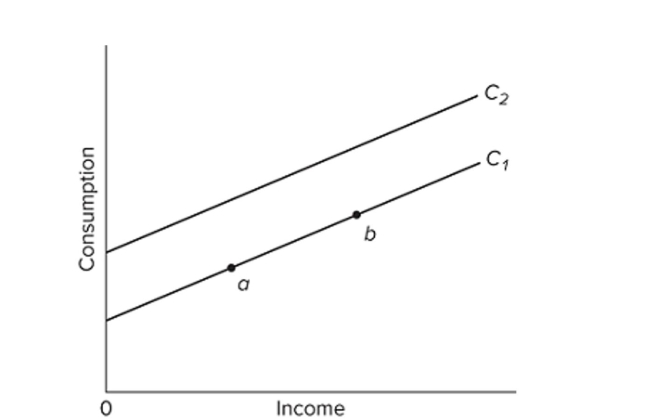 Refer to the given graph. A shift of the consumption schedule from C2 to C1 might be caused by a(n)
A) increase in real GDP.
B) reverse wealth effect, caused by a decrease in stock market prices.
C) decrease in income tax rates.
D) decrease in saving.
F) None of the above
Correct Answer

verified
Correct Answer
verified
Multiple Choice
If the MPC is 0.70 and investment increases by $3 billion, the equilibrium GDP will
A) increase by $10 billion.
B) increase by $2.10 billion.
C) decrease by $4.29 billion.
D) increase by $4.29 billion.
F) None of the above
Correct Answer

verified
Correct Answer
verified
Multiple Choice
The consumption and saving schedules reveal that the
A) MPC is greater than zero but less than one.
B) MPC and APC are equal at the point where the consumption schedule intersects the 45- degree line.
C) APS is positive at all income levels.
D) MPC is equal to or greater than one at all income levels.
F) B) and C)
Correct Answer

verified
Correct Answer
verified
Showing 81 - 100 of 233
Related Exams