A) costs has resulted in an overallocation of resources to X.
B) benefits has resulted in an overallocation of resources to X.
C) costs has resulted in an underallocation of resources to X.
D) benefits has resulted in an underallocation of resources to X.
F) A) and C)
Correct Answer

verified
Correct Answer
verified
Multiple Choice
Some sellers of used cars provide warranties to buyers, with the aim of reassuring buyers that the car is of good quality. These warranties help reduce the chance of what occurring?
A) negative externalities
B) adverse selection
C) spillover benefits
D) moral hazard
F) C) and D)
Correct Answer

verified
Correct Answer
verified
Multiple Choice
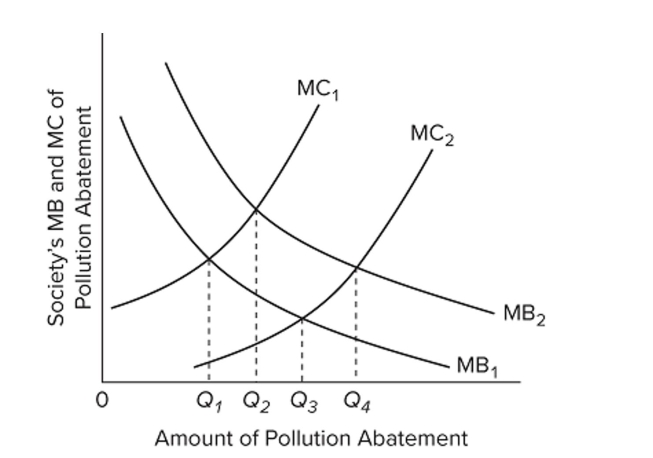 Refer to the diagram. Which one of the following might shift the marginal cost curve from MC1 to MC2?
A) major new studies strongly linking cancer to pollution
B) improved technology for reducing pollution
C) a change in consumer tastes from services to manufactured goods
D) an increase in the price of recycled goods
F) A) and D)
Correct Answer

verified
Correct Answer
verified
True/False
Insurance co-pays and deductibles are methods used by insurance companies to reduce moral hazard.
B) False
Correct Answer

verified
Correct Answer
verified
True/False
When the government bails out failing banks, it creates a moral hazard problem; but when the government bails out homeowners who are defaulting on their mortgages, there is no moral hazard problem.
B) False
Correct Answer

verified
Correct Answer
verified
Multiple Choice
It is the custom for paper mills located alongside the Layzee River to discharge waste products into the river. As a result, operators of hydroelectric power-generating plants downstream along the river find that they must clean up the river's water before it flows through their equipment. If the government intervenes and corrects the externality in the situation described, we would Expect
A) the supply of the output from the hydroelectric power plants to decrease.
B) the supply of the output from the hydroelectric power plants to increase.
C) the demand for the output from the hydroelectric power plants to decrease.
D) the demand for the output from the hydroelectric power plants to increase.
F) A) and D)
Correct Answer

verified
Correct Answer
verified
Multiple Choice
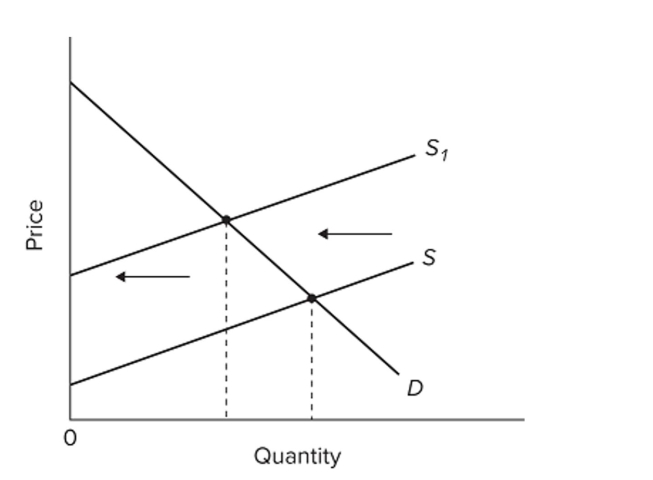 Refer to the diagram, in which S is the market supply curve and S1 is a supply curve comprising all costs of production, including external costs. Assume that the number of people affected by these
External costs is large. If the government wishes to establish an optimal allocation of resources in
This market, it should
A) not intervene because the market outcome is optimal.
B) subsidize consumers so that the market demand curve shifts leftward.
C) subsidize producers so that the market supply curve shifts leftward.
D) tax producers so that the market supply curve shifts leftward.
F) None of the above
Correct Answer

verified
Correct Answer
verified
Multiple Choice
When a competitive market achieves allocative efficiency, it implies that
A) the marginal benefit of having the product is greater than the marginal cost.
B) the buyers are getting the maximum consumer surplus from the product.
C) the combined consumer and producer surplus is maximized.
D) the quantity demanded is lower than the quantity supplied.
F) A) and C)
Correct Answer

verified
Correct Answer
verified
Multiple Choice
Refer to the provided table. The producer surplus is $4 for producer
A) A.
B) B.
C) C.
D) D.
F) None of the above
Correct Answer

verified
Correct Answer
verified
Multiple Choice
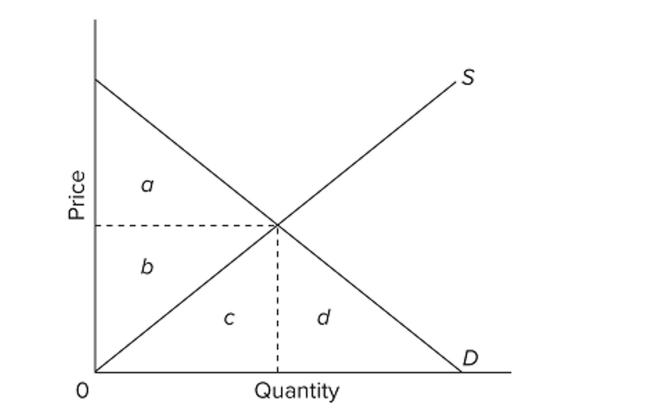 In the provided graph, the equilibrium point in the market is where the S and D curves intersect. At equilibrium, the total maximum amount that consumers would have been willing to pay for the
Product is represented by the area
A) a + b.
B) a + b + c.
C) a.
D) b + c.
F) A) and D)
Correct Answer

verified
Correct Answer
verified
Multiple Choice
If the demand curve reflects consumers' full willingness to pay, and the supply curve reflects all costs of production, then which of the following is true?
A) The benefit surpluses shared between consumers and producers will be maximized.
B) The benefit surpluses received by consumers and producers will be equal.
C) There will be no consumer or producer surplus.
D) Consumer surplus will be maximized, and producer surplus will be minimized.
F) A) and C)
Correct Answer

verified
Correct Answer
verified
True/False
(Consider This) People with high opportunity costs for time won't mind sitting in traffic.
B) False
Correct Answer

verified
Correct Answer
verified
Multiple Choice
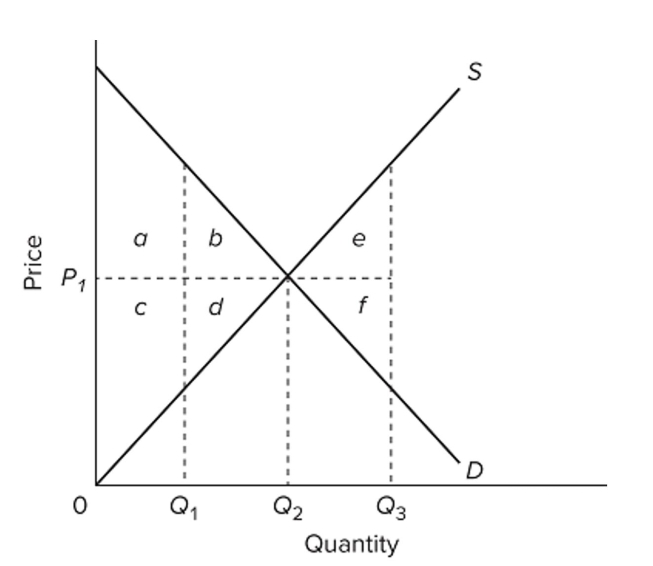 Refer to the diagram. If actual production and consumption occur at Q1,
A) efficiency is achieved.
B) consumer surplus is maximized.
C) an efficiency loss (or deadweight loss) of b + d occurs.
D) an efficiency loss (or deadweight loss) of e + d occurs.
F) A) and B)
Correct Answer

verified
Correct Answer
verified
True/False
The licensing and regulation of financial advisers is one way by which the government tries to deal with the problem of inadequate information that financial firms have about their customers.
B) False
Correct Answer

verified
Correct Answer
verified
Multiple Choice
An efficiency loss (or deadweight loss) declines in size when a unit of output is produced for which
A) marginal cost exceeds marginal benefit.
B) maximum willingness to pay exceeds minimum acceptable price.
C) consumer surplus exceeds producer surplus.
D) producer surplus exceeds consumer surplus.
F) A) and D)
Correct Answer

verified
Correct Answer
verified
Multiple Choice
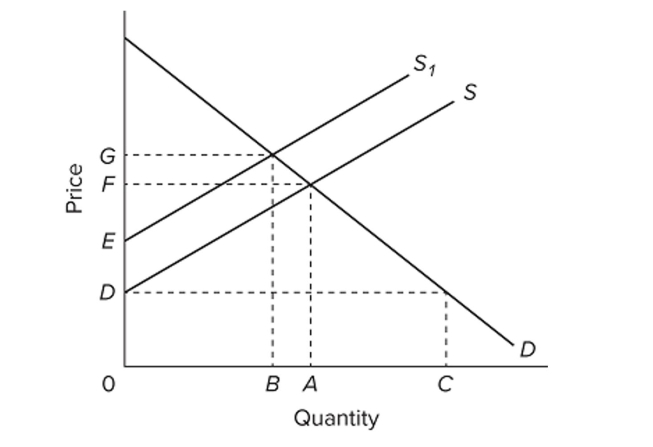 Refer to the provided supply and demand graph for a product. In the graph, line S is the current supply of this product, while line S1 is the optimal supply from the society's perspective. One
Solution to this externality problem is to
A) give consumers a subsidy of the amount FG per unit.
B) give producers a subsidy of the amount AB per unit.
C) tax producers by the amount DE per unit.
D) tax consumers by the amount EF per unit.
F) C) and D)
Correct Answer

verified
Correct Answer
verified
Multiple Choice
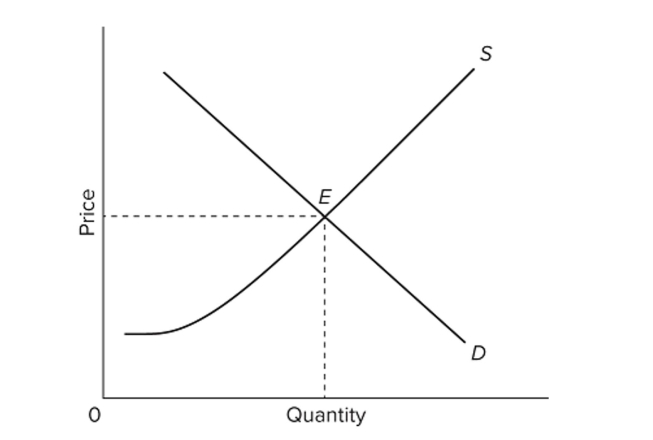 Refer to the provided graph. Suppose consumers do not know the safety risks associated with a particular good and that the free-market equilibrium is at E, as shown in the diagram above. If an
Independent agency now provides accurate information to consumers about the harmful
Characteristics of the product, then
A) the supply curve will shift to the left.
B) the supply curve will shift to the right.
C) both the new equilibrium price and quantity will be lower.
D) the new equilibrium price will be higher but the equilibrium quantity will be either higher or lower.
F) A) and B)
Correct Answer

verified
Correct Answer
verified
Multiple Choice
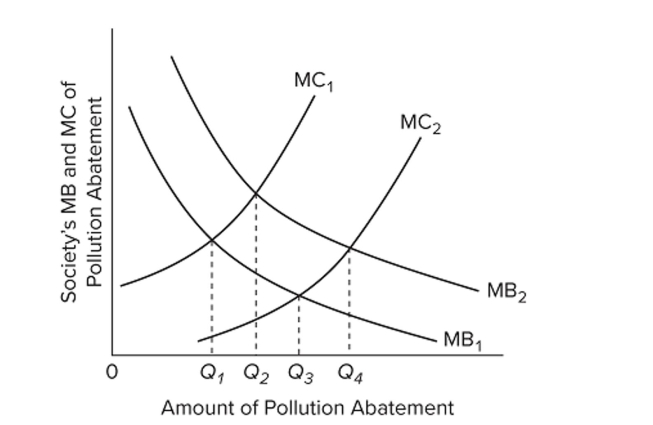 Refer to the diagram. From society's perspective, if MB2 and MC1 are relevant,
A) Q4 represents too little pollution abatement.
B) Q1 represents too little pollution abatement.
C) Q3 represents an optimal amount of pollution abatement.
D) Q2 represents too little pollution abatement.
F) B) and C)
Correct Answer

verified
Correct Answer
verified
Multiple Choice
(Consider This) Suppose that a large tree on Betty's property is blocking Chuck's view of the lake below. Betty accepts Chuck's offer to pay Betty $100 for the right to cut down the tree. This situation Describes
A) the Coase theorem.
B) the optimal allocation of a social good.
C) a positive externality.
D) a market for externality rights.
F) A) and B)
Correct Answer

verified
Correct Answer
verified
Multiple Choice
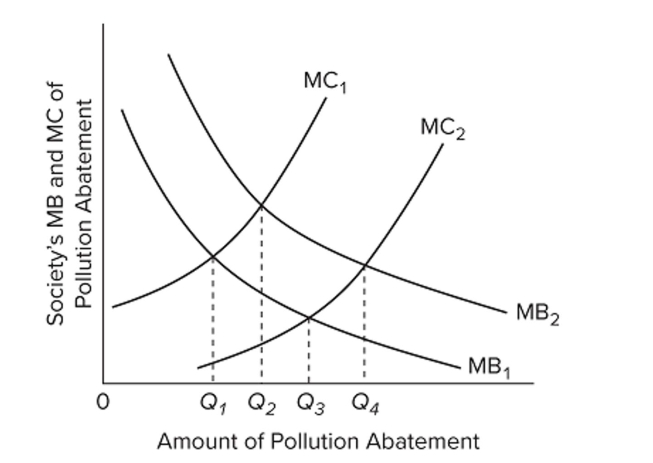 Refer to the diagram. Which one of the following might shift the marginal benefit curve from MB1 to MB2?
A) major new studies strongly linking cancer to pollution
B) improved technology for reducing pollution
C) a change in consumer tastes from manufactured goods to services
D) a decrease in the price of recycled goods
F) All of the above
Correct Answer

verified
Correct Answer
verified
Showing 21 - 40 of 222
Related Exams