A) consumer incomes have declined, and consumers now want to buy less of A at each possible price.
B) the price of A has increased and, as a result, consumers want to purchase less of it.
C) consumer preferences have changed in favor of A so they now want to buy more at each possible price.
D) the price of A has declined and, as a result, consumers want to purchase more of it.
F) A) and C)
Correct Answer

verified
Correct Answer
verified
Multiple Choice
The following are explanations of the Law of Demand, except
A) expectations effect.
B) diminishing marginal utility.
C) income effect.
D) substitution effect.
F) B) and D)
Correct Answer

verified
Correct Answer
verified
Multiple Choice
If there is a surplus of a product, its price
A) is below the equilibrium level.
B) is above the equilibrium level.
C) will rise in the near future.
D) is in equilibrium.
F) B) and D)
Correct Answer

verified
Correct Answer
verified
Multiple Choice
A headline reads, "Lumber Prices Up Sharply." In a competitive market, this situation would lead to a(n)
A) increase in the price and quantity of new homes.
B) decrease in the price and quantity of new homes.
C) increase in the price of new homes and decrease in quantity.
D) decrease in the price of new homes and increase in quantity.
F) C) and D)
Correct Answer

verified
Correct Answer
verified
Multiple Choice
Refer to the table. Suppose that demand is represented by columns (3) and (2) and supply is represented by columns (3) and (5) . If the price were arti?cially set at $9,
A) the market would clear.
B) a surplus of 20 units would occur.
C) a shortage of 20 units would occur.
D) demand would change from columns (3) and (2) to columns (3) and (1) .
F) A) and D)
Correct Answer

verified
Correct Answer
verified
Multiple Choice
If an economy is being "productively efficient," then that means the economy is
A) producing the products most wanted by society.
B) fully employing all economic resources.
C) maximizing the returns to factors of production.
D) using the least costly production techniques.
F) A) and B)
Correct Answer

verified
Correct Answer
verified
Multiple Choice
Which of the following would most likely increase the demand for gasoline?
A) the expectation by consumers that gasoline prices will be higher in the future
B) the expectation by consumers that gasoline prices will be lower in the future
C) a widespread shift in car ownership from SUVs to hybrid sedans
D) a decrease in the price of public transportation
F) A) and B)
Correct Answer

verified
Correct Answer
verified
Multiple Choice
At the current price, there is a shortage of a product. We would expect price to
A) increase, quantity demanded to increase, and quantity supplied to decrease.
B) increase, quantity demanded to decrease, and quantity supplied to increase.
C) increase, quantity demanded to increase, and quantity supplied to increase.
D) decrease, quantity demanded to increase, and quantity supplied to decrease.
F) All of the above
Correct Answer

verified
Correct Answer
verified
Multiple Choice
Which of the following statements about ticket scalping is correct?
A) Scalping tends to be prevalent when there is a surplus of tickets.
B) Scalping tends to be prevalent when there is a shortage of tickets.
C) Scalping benefits only one party-the sellers-but not the buyers.
D) Scalping benefits only one party-the buyers-but not the sellers.
F) A) and B)
Correct Answer

verified
Correct Answer
verified
Multiple Choice
An increase in product price will cause
A) quantity demanded to decrease.
B) quantity supplied to decrease.
C) quantity demanded to increase.
D) the supply curve to shift to the left.
F) B) and C)
Correct Answer

verified
Correct Answer
verified
Multiple Choice
With a downsloping demand curve and an upsloping supply curve for a product, placing an excise tax on this product will
A) increase equilibrium price and quantity.
B) decrease equilibrium price and quantity.
C) decrease equilibrium price and increase equilibrium quantity.
D) increase equilibrium price and decrease equilibrium quantity.
F) A) and B)
Correct Answer

verified
Correct Answer
verified
Multiple Choice
Markets, viewed from the perspective of the supply and demand model,
A) assume many buyers and many sellers of a standardized product.
B) assume market power so that buyers and sellers bargain with one another.
C) do not exist in the real-world economy.
D) are approximated by markets in which a single seller determines price.
F) B) and C)
Correct Answer

verified
Correct Answer
verified
Multiple Choice
(Consider This) Suppose that coffee growers sell 200 million pounds of coffee beans at $2 per pound in 2015 and 240 million pounds for $3 per pound in 2016. Based on this information, we can Conclude that the
A) law of supply has been violated.
B) law of demand has been violated.
C) demand for coffee beans has increased.
D) supply of coffee beans has increased.
F) B) and C)
Correct Answer

verified
Correct Answer
verified
Multiple Choice
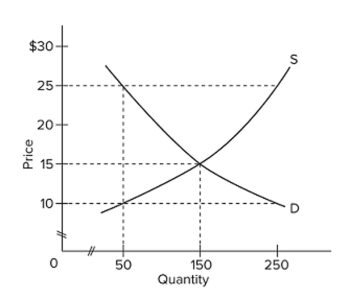
 In a competitive market illustrated by the diagram above, a price ceiling of $25 per unit will result in
A) the market staying at an equilibrium price of $15.
B) a surplus of 200 units.
C) a shortage of 200 units.
D) a shortage of 150 units.
F) A) and C)
Correct Answer

verified
Correct Answer
verified
Multiple Choice
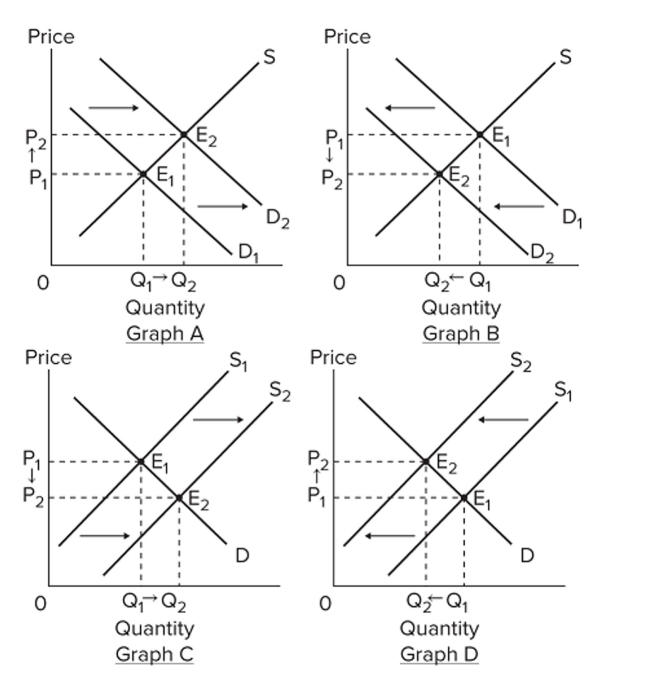
Assume that the graphs show a competitive market for the product stated in the question.  Select the graph above that best shows the change in the market specified in the following
Situation: the market for chicken, when the price of a substitute, such as beef, decreases.
A) Graph A
B) Graph B
C) Graph C
D) Graph D
F) A) and C)
Correct Answer

verified
Correct Answer
verified
Multiple Choice
For most products, purchases tend to fall with decreases in buyers' incomes. Such products are known as
A) inferior goods.
B) direct goods.
C) average goods.
D) normal goods.
F) A) and C)
Correct Answer

verified
Correct Answer
verified
Multiple Choice
As a result of a decrease in the price of online streaming movies, consumers download more movies online and buy fewer DVDs. This is an illustration of
A) consumer sovereignty.
B) the income effect.
C) the substitution effect.
D) diminishing marginal utility.
F) A) and C)
Correct Answer

verified
Correct Answer
verified
Multiple Choice
(Last Word) According to recent research, which of the following best explains rising tuition costs over the past several years?
A) increased federal subsidies for student loans
B) increased spending on faculty salaries
C) increased spending on technological infrastructure, including digital classrooms and internet connectivity
D) widespread closing of colleges and universities, leading to a dramatic reduction in the supply of higher education
F) B) and C)
Correct Answer

verified
Correct Answer
verified
Multiple Choice
When economists say that the demand for a product has decreased, they mean that
A) the demand curve has shifted to the right.
B) the product has become particularly scarce for some reason.
C) the product has become more expensive and thus consumers are buying less of it.
D) consumers are now willing and able to buy less of this product at each possible price.
F) A) and B)
Correct Answer

verified
Correct Answer
verified
Multiple Choice
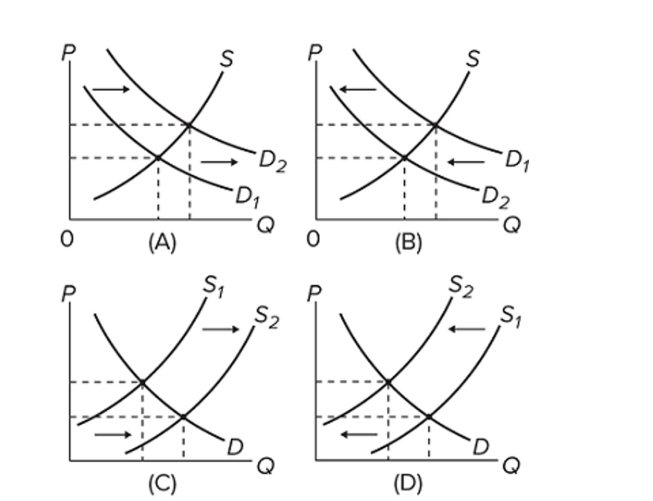
 Which of the diagrams illustrate(s) the effect of a decrease in incomes on the market for second- hand clothing?
A) A and C
B) A only
C) B only
D) C only
F) B) and C)
Correct Answer

verified
Correct Answer
verified
Showing 321 - 340 of 357
Related Exams