A) production by 75 units.
B) production by 35 units.
C) prices by $5.
D) prices by $11.
F) C) and D)
Correct Answer

verified
Correct Answer
verified
Multiple Choice
We might predict that Hawaii has a comparative advantage compared to Russia in the production of pineapples because Hawaii has:
A) a climate more suitable for pineapples.
B) more land available to grow them on.
C) more advanced farming technology.
D) less governmental oversight in the pineapple industry.
F) A) and C)
Correct Answer

verified
Correct Answer
verified
Multiple Choice
This graph demonstrates the domestic demand and supply for a good,as well as a tariff and the world price for that good. 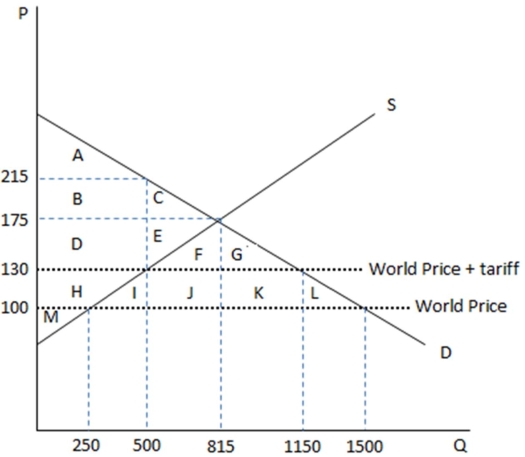 According to the graph shown,the change to government revenue brought about by the introduction of a tariff to an economy once operating under free trade is:
A) an increase of area JK.
B) an increase of area FGJK.
C) an increase of area IJKL.
D) a decrease of area IL.
F) B) and C)
Correct Answer

verified
Correct Answer
verified
Multiple Choice
When a country gains from trade:
A) everyone in that country benefits from the trade.
B) the net gain of surplus is positive for that country.
C) the total producer surplus increased in the country.
D) the total consumer surplus increased in the country.
F) B) and D)
Correct Answer

verified
Correct Answer
verified
Multiple Choice
A country may gain a temporary comparative advantage if it:
A) remains self-sufficient until it stockpiles enough inventory to supply the world.
B) is the first to discover and implement a new technology or production process.
C) remains a political ally to all.
D) All of these are true.
F) B) and C)
Correct Answer

verified
Correct Answer
verified
Multiple Choice
A country is likely to have a comparative advantage in a capital-intensive activity if it has a:
A) lot of land relative to its population.
B) large amount of capital relative to its landmass.
C) higher opportunity cost of producing technology.
D) higher amount of labor relative to its population.
F) A) and D)
Correct Answer

verified
Correct Answer
verified
Multiple Choice
This graph demonstrates the domestic demand and supply for a good,as well as the world price for that good. 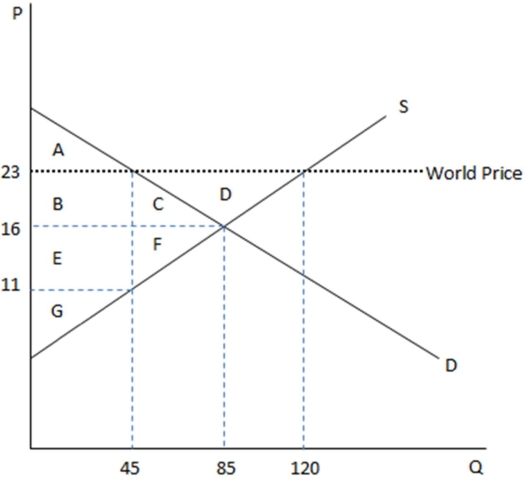 According to the graph shown,what is the world price?
A) $16
B) $11
C) $23
D) $45
F) A) and C)
Correct Answer

verified
Correct Answer
verified
Multiple Choice
Technology or production processes developed in a particular country:
A) may give that country a temporary comparative advantage.
B) may set that country back until they earn back the research and development costs.
C) will give that country a permanent comparative advantage.
D) generally are not transferrable to other nations.
F) None of the above
Correct Answer

verified
Correct Answer
verified
Multiple Choice
This graph demonstrates the domestic demand and supply for a good,as well as a tariff and the world price for that good. 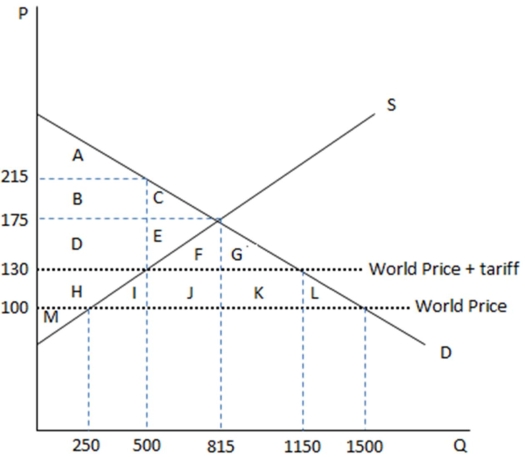 According to the graph shown,if the economy were operating in autarky and then moved to free trade,the overall impact on surplus would be a net:
A) gain of FGIJKL.
B) loss of FGIJKL.
C) gain of FGJK.
D) loss of FGJK.
F) A) and C)
Correct Answer

verified
Correct Answer
verified
Multiple Choice
For a country to be a price taker in the global market for some good:
A) the quantity it produces and consumes must be very small relative to the total amount of that good bought and sold worldwide.
B) the quantity it produces and consumes must be very large relative to the total amount of that good bought and sold worldwide.
C) there must be many sellers all supplying a very significant amount to the market.
D) there must be many buyers all buying a large amount from the market.
F) All of the above
Correct Answer

verified
Correct Answer
verified
Multiple Choice
Exports are goods and services that are produced:
A) in other countries and consumed domestically.
B) domestically and consumed in other countries.
C) and consumed in other countries.
D) and consumers domestically.
F) C) and D)
Correct Answer

verified
Correct Answer
verified
Multiple Choice
This graph demonstrates the domestic demand and supply for a good,as well as the world price for that good. 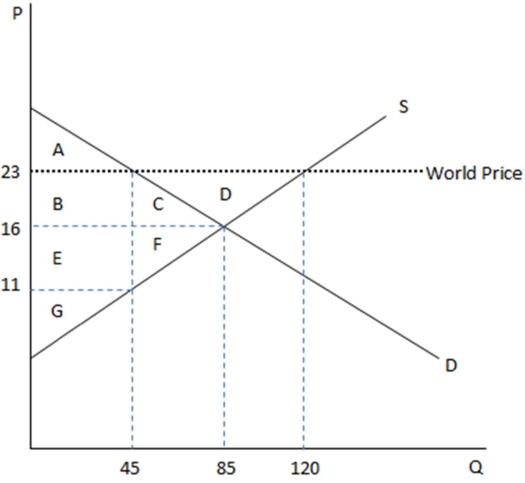 According to the graph shown,if this economy was to engage in free trade,the good would:
A) be imported.
B) be exported.
C) no longer be produced domestically.
D) not be imported or exported and only be produced domestically.
F) B) and D)
Correct Answer

verified
Correct Answer
verified
Multiple Choice
This graph demonstrates the domestic demand and supply for a good,as well as a tariff and the world price for that good. 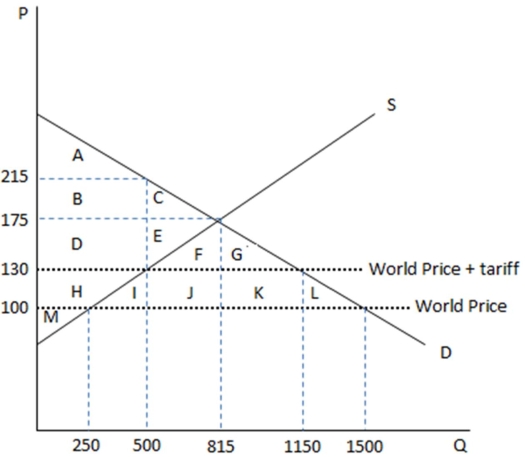 According to the graph shown,if the economy is operating under free trade,who would be opposed to a tariff?
A) Foreign producers
B) Domestic consumers
C) Domestic producers
D) Both A and B would be opposed to a tariff.
F) B) and D)
Correct Answer

verified
Correct Answer
verified
Multiple Choice
If a country has a comparative advantage in wine moved from autarky to free trade,this would cause what reaction in the world market?
A) Foreign wine producers would be opposed.
B) Domestic wine consumers would be opposed.
C) Domestic wine producers would be opposed.
D) Domestic wine consumers would not be influenced.
F) A) and B)
Correct Answer

verified
Correct Answer
verified
Multiple Choice
This graph demonstrates the domestic demand and supply for a good,as well as a tariff and the world price for that good. 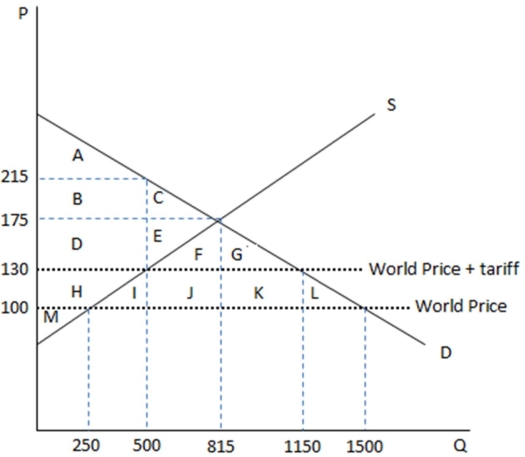 According to the graph shown,the area ABC represents consumer surplus in an economy with:
A) free trade.
B) autarky.
C) a tariff being imposed on trade.
D) None of these is true.
F) None of the above
Correct Answer

verified
Correct Answer
verified
Multiple Choice
Once a new technology spreads and is adopted by many countries:
A) the first country to use it may lose its comparative advantage.
B) the first country to use it will lose its absolute advantage.
C) other countries will perfect it, putting them at an absolute advantage.
D) the country will have to have strict intellectual property rights protections in place.
F) A) and C)
Correct Answer

verified
Correct Answer
verified
Multiple Choice
Comparative advantage is the ability to produce:
A) more of a good than others with a given amount of resources.
B) relatively more than any other good with a given amount of resources.
C) a good or service at a lower opportunity cost than others.
D) more of a good at a lower cost.
F) A) and D)
Correct Answer

verified
Correct Answer
verified
Multiple Choice
Profits earned by foreign firms or governments under a quota are called:
A) quota rents.
B) quota revenue.
C) trade costs.
D) trade rents.
F) All of the above
Correct Answer

verified
Correct Answer
verified
Multiple Choice
When a country has the ability to produce more of a good than others with a given amount of resources,they:
A) have an absolute advantage.
B) have a comparative advantage.
C) are free-traders.
D) should remain self-sufficient.
F) C) and D)
Correct Answer

verified
Correct Answer
verified
Multiple Choice
This graph demonstrates the domestic demand and supply for a good,as well as the world price for that good. 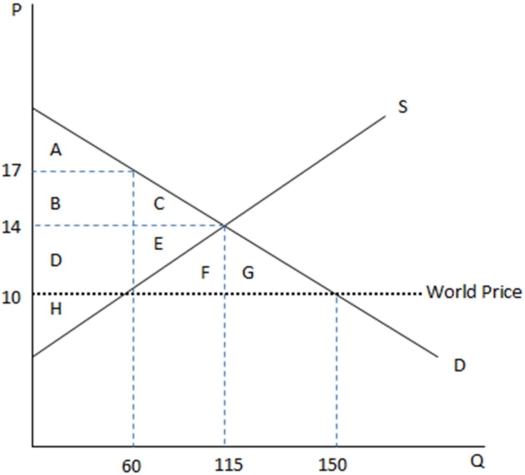 According to the graph shown,if this economy were to open to trade,domestic prices would:
A) remain $14 for domestically produced goods, and be $10 for those units imported.
B) drop to $10 for all units.
C) remain $14, with more units sold overall.
D) increase to $17 for all units sold.
F) A) and D)
Correct Answer

verified
Correct Answer
verified
Showing 121 - 140 of 141
Related Exams