A) Move the economy to point A
B) Move the economy to point B
C) Move the economy to point D
D) Shift the AD curve to the left
F) A) and B)
Correct Answer

verified
Correct Answer
verified
Multiple Choice
Suppose that an economy produces 2400 units of output, employing the 60 units of input, and the price of the input is $30 per unit. Refer to the information above. All else equal, if the price of each unit of input decreased from $30 to $20, then productivity would:
A) Increase from $40 to $90 and aggregate supply would decrease
B) Increase from $50 to $60 and aggregate supply would decrease
C) Increase from $60 to $70 and aggregate supply would increase
D) Remain unchanged but aggregate supply would increase
F) None of the above
Correct Answer

verified
Correct Answer
verified
Multiple Choice
When national income in other nations decreases, aggregate demand in our economy:
A) Increases because our exports will increase
B) Decreases because our exports will decrease
C) Increases because our imports will decrease
D) Decreases because our imports will increase
F) A) and D)
Correct Answer

verified
Correct Answer
verified
Multiple Choice
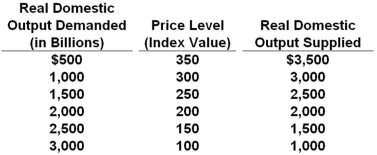
It shows the aggregate demand and aggregate supply schedule for a hypothetical economy.  Refer to the table above. If the quantity of real domestic output demanded increased by $1000 at each price level, the new equilibrium price level and quantity of real domestic output would be:
A) 150 and $2500
B) 250 and $2500
C) 200 and $2000
D) 300 and $3000
F) All of the above
Correct Answer

verified
Correct Answer
verified
Multiple Choice
A sharp rise in the real value of stock prices, which is independent of a change in the price level, would best be an example of:
A) The interest-rate effect
B) The real-balances effect
C) A change in the degree of excess capacity
D) A change in real value of consumer wealth
F) A) and C)
Correct Answer

verified
Correct Answer
verified
True/False
Minimum wage laws tend to make the price level more flexible rather than less flexible.
B) False
Correct Answer

verified
Correct Answer
verified
True/False
Depreciation of the dollar relative to foreign currencies will tend to increase net exports and thus aggregate demand of the U.S. economy.
B) False
Correct Answer

verified
Correct Answer
verified
True/False
If the cost of resources decreases, then real domestic output will increase.
B) False
Correct Answer

verified
Correct Answer
verified
Multiple Choice
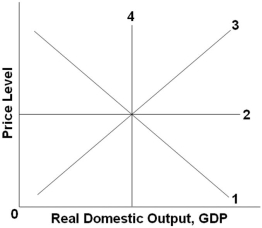
 Refer to the graph above. Which line might represent an immediate-short-run aggregate supply curve?
A) 1
B) 2
C) 3
D) 4
F) A) and B)
Correct Answer

verified
Correct Answer
verified
Multiple Choice
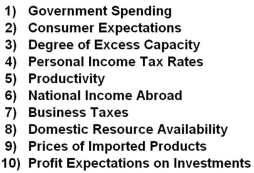
Answer the question based on the following list of items that are related to aggregate demand and/or aggregate supply.  Refer to the list above. Changes in which combination of factors best explain why the aggregate supply curve would shift?
A) 1 and 2
B) 2 and 10
C) 3 and 6
D) 7 and 8
F) B) and C)
Correct Answer

verified
Correct Answer
verified
Multiple Choice
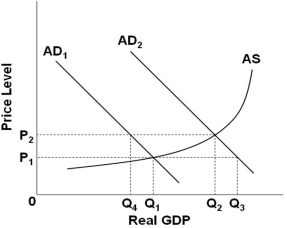
 Refer to the figure above. If the economy is operating at full employment when its aggregate demand curve is AD2, then a further increase in consumption and investment spending will cause:
A) Cost-push inflation, and the new equilibrium output will be less than Q2
B) Demand-pull inflation, and the new equilibrium output will be less than Q2
C) Demand-pull inflation, and the new equilibrium output will be more than Q2
D) Cost-push inflation, and the new equilibrium output will be more than Q2
F) A) and C)
Correct Answer

verified
Correct Answer
verified
Multiple Choice
In the mid-1970s, changes in oil prices greatly affected U.S. inflation. When oil prices rose, the U.S. would experience:
A) Cost-push inflation and rising output
B) Demand-pull inflation and rising output
C) Cost-push inflation and falling output
D) Demand-pull inflation and falling output
F) C) and D)
Correct Answer

verified
Correct Answer
verified
Showing 141 - 152 of 152
Related Exams