A) Consumption also increases, and by more than the increase in income
B) Consumption also increases, and at the same rate as the increase in income
C) Consumption will go in the opposite direction and decrease
D) Consumption also increases, though not as much as income
F) A) and C)
Correct Answer

verified
Correct Answer
verified
Multiple Choice
If disposable income decreases from $1800 to $1500 and MPC = 0.75, then saving will:
A) Increase by $225
B) Decrease by $225
C) Increase by $75
D) Decrease by $75
F) B) and D)
Correct Answer

verified
Correct Answer
verified
Multiple Choice
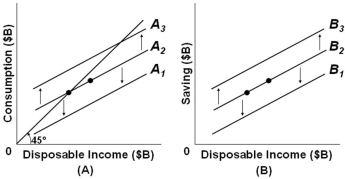
 Refer to the above figures with consumption schedules in figure (A) and saving schedules in figure (B) , which correspond to each other across different levels of disposable income. If, in figure (A) , consumption increases along line A2 then in figure (B) there would be:
A) A shift from line B2 to B3
B) A shift from line B2 to B1
C) A movement down along line B2
D) A movement up along line B2
F) A) and B)
Correct Answer

verified
Correct Answer
verified
Multiple Choice
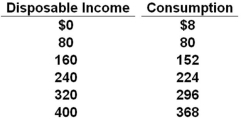
The disposable income (DI) and consumption (C) schedules are for a private, closed economy. All figures are in billions of dollars.  Refer to the data above. If plotted on a graph, the slope of the consumption schedule would be:
A) .6
B) .7
C) .8
D) .9
F) A) and B)
Correct Answer

verified
Correct Answer
verified
Multiple Choice
Assume that an increase in a household's disposable income from $40,000 to $48,000 leads to an increase in consumption from $35,000 to $41,000, then the:
A) Slope of the consumption schedule is .75
B) Average propensity to consume is .75
C) Marginal propensity to save is .20
D) Marginal propensity to consume is .6
F) A) and B)
Correct Answer

verified
Correct Answer
verified
Multiple Choice
If there is a decrease in disposable income in an economy, then:
A) Both the APC and the APS rise
B) The APC rises and the APS falls
C) The APC falls and the APS rises
D) Both the APC and the APS fall
F) A) and B)
Correct Answer

verified
Correct Answer
verified
Multiple Choice
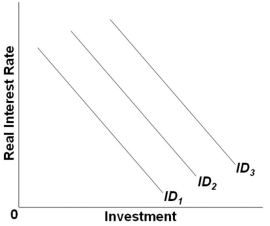
 Refer to the graph above. Which of the following would shift the investment demand curve from ID2 to ID3?
A) Greater inventories of capital goods
B) Higher business taxes on capital goods
C) A more rapid rate of technological progress
D) Lower expected rates of return on investment in capital goods
F) C) and D)
Correct Answer

verified
Correct Answer
verified
Multiple Choice
In an economy, for every $10 million increase in disposable income, saving increases by $2 million. It can be concluded that the:
A) Slope of the saving schedule is 2
B) Slope of the consumption schedule is .8
C) Marginal propensity to consume is .2
D) Average propensity to save is 0.2
F) A) and D)
Correct Answer

verified
Correct Answer
verified
Multiple Choice
Answer the following question based on the table below which illustrates the multiplier process resulting from an autonomous increase in investment by $5.  Refer to the above table. The change in income in round two will be:
A) $0.94
B) $2.81
C) $3.75
D) $4.00
F) All of the above
Correct Answer

verified
Correct Answer
verified
Multiple Choice
As disposable income decreases, consumption:
A) And saving both increase
B) And saving both decrease
C) Increases and saving decreases
D) Decreases and saving increases
F) B) and C)
Correct Answer

verified
Correct Answer
verified
Multiple Choice
If consumption increases while income remains the same, the average propensity to consume will:
A) Increase and then decrease
B) Remain constant
C) Increase
D) Decrease
F) A) and C)
Correct Answer

verified
Correct Answer
verified
Multiple Choice
During the Great Recession of 2007-2009, real interest rates:
A) Declined to about zero, and investments increased sharply
B) Declined to about zero, and investments also declined sharply
C) Increased sharply, and investments declined significantly
D) Increased sharply, and investments also rose significantly
F) B) and C)
Correct Answer

verified
Correct Answer
verified
True/False
A business firm will purchase additional capital goods if the real rate of interest in the economy is less than the expected rate of return from the investment.
B) False
Correct Answer

verified
Correct Answer
verified
True/False
An increase in business taxes will tend to shift the investment-demand curve rightward.
B) False
Correct Answer

verified
Correct Answer
verified
True/False
The wealth effect will tend to decrease consumption and increase saving.
B) False
Correct Answer

verified
Correct Answer
verified
Multiple Choice
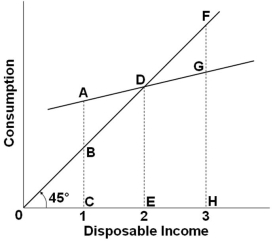
 Refer to the consumption schedule above. At income level 3, the amount of saving is represented by the line segment:
A) FG
B) FH
C) FD
D) GH
F) A) and D)
Correct Answer

verified
Correct Answer
verified
Multiple Choice
As the consumption and saving schedules relate to real GDP, an increase in taxes will shift:
A) Upward both the consumption and saving schedules
B) Downward both the consumption and saving schedules
C) The consumption schedule upward and the saving schedule downward
D) The saving schedule upward and the consumption schedule downward
F) None of the above
Correct Answer

verified
Correct Answer
verified
Multiple Choice
During the Great Recession of 2007-2009, the investment demand curve shifted:
A) Left because of very low interest rates
B) Right because of very low interest rates
C) Left because of declines in expected returns
D) Right because of reductions in tax rates
F) A) and C)
Correct Answer

verified
Correct Answer
verified
Multiple Choice
If the slope of a linear consumption schedule increases in a private closed economy, then it can be concluded that the:
A) MPS has increased
B) MPC has increased
C) Income has increased
D) Income has decreased
F) B) and C)
Correct Answer

verified
Correct Answer
verified
True/False
An increase in taxes will shift both the consumption schedule and the saving schedule down.
B) False
Correct Answer

verified
Correct Answer
verified
Showing 81 - 100 of 142
Related Exams