A) A decrease in the cost of feed for pigs
B) Decreased advertising of pork
C) An increase in the cost of producing beef
D) A subsidy to pork producers
F) C) and D)
Correct Answer

verified
Correct Answer
verified
Multiple Choice
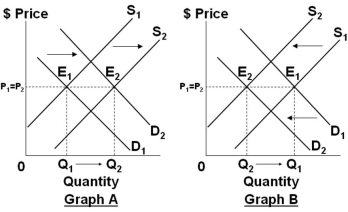
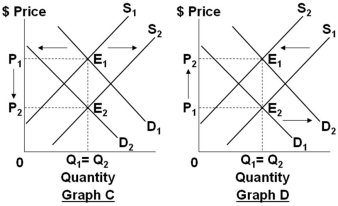 Refer to the four graphs above. In which graph would the indicated shifts cause equilibrium quantity to definitely rise, but the effect on price is indeterminate?
A) Graph A
B) Graph B
C) Graph C
D) Graph D
F) A) and C)
Correct Answer

verified
Correct Answer
verified
Multiple Choice
If the market price is above the equilibrium price:
A) A shortage will occur and producers will produce more and lower prices
B) A surplus will occur and producers will produce less and lower prices
C) A surplus will result and consumers will bid prices up
D) Producers will make extremely high profits
F) All of the above
Correct Answer

verified
Correct Answer
verified
Multiple Choice
Suppose that goods A and B are close substitutes. If the price of good A falls, then we would expect an:
A) Increase in the demand for A and an increase in the quantity of B demanded
B) Increase in the demand for A and a decrease in the quantity of B demanded
C) Increase in the quantity of A demanded and a decrease in the demand for B
D) Increase in the demand for good A as well as for good B
F) B) and C)
Correct Answer

verified
Correct Answer
verified
True/False
If there is a surplus in a market, competition among the sellers will drive price down.
B) False
Correct Answer

verified
Correct Answer
verified
Multiple Choice
Assume that the graphs show a competitive market for the product stated in the question. 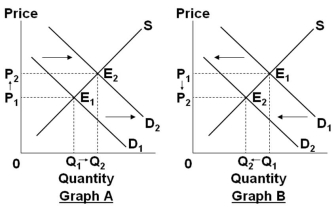
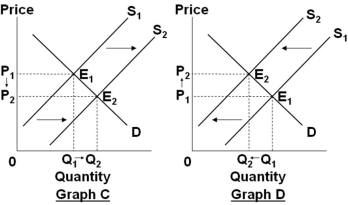 Select the graph above that best shows the change in the market specified in the following situation: In the market for digital cameras, when the productivity of workers in the digital camera industry increases.
A) Graph A
B) Graph B
C) Graph C
D) Graph D
F) A) and B)
Correct Answer

verified
Correct Answer
verified
Multiple Choice
Which of the following factors is a "demand shifter" for new houses?
A) The price of lumber
B) Wages for construction workers
C) The price of new houses
D) The interest rates on mortgage loans
F) None of the above
Correct Answer

verified
Correct Answer
verified
Multiple Choice
A government will create a surplus in a market when it:
A) Sets a price ceiling above the equilibrium price
B) Sets a price floor above the equilibrium price
C) Sets a price floor below the equilibrium price
D) Sets a price ceiling below the equilibrium price
F) B) and C)
Correct Answer

verified
Correct Answer
verified
Multiple Choice
A large increase in the supply of HD-TV sets occurs simultaneously with a smaller decrease in its demand. As a result the equilibrium price will:
A) Increase and the equilibrium quantity will decrease
B) Increase and the equilibrium quantity will increase
C) Decrease and the equilibrium quantity will decrease
D) Decrease and the equilibrium quantity will increase
F) A) and C)
Correct Answer

verified
Correct Answer
verified
Multiple Choice
Sometimes, we observe cases where the price of a product rose and the quantity bought by buyers also increased. Such cases occur due to a violation of the:
A) Law of Demand
B) Law of Supply
C) Allocative efficiency rule
D) Ceteris paribus assumption
F) All of the above
Correct Answer

verified
Correct Answer
verified
Multiple Choice
Which would be a likely cause of an increase in the demand for pizza?
A) A reduced desire for take-out and fast-food dining
B) A decrease in the price of hamburger sandwiches
C) A decrease in the prices of cheese, pepperoni, and mushrooms
D) A health report showing eating pizza reduces stress
F) B) and C)
Correct Answer

verified
Correct Answer
verified
Multiple Choice
Assume that the graphs show a competitive market for the product stated in the question. 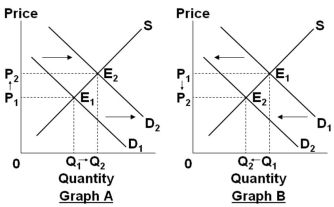
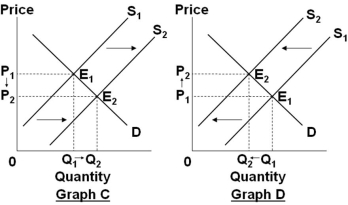 Select the graph above that best shows the change in the market specified in the following situation: In the market for houses, when consumers experience a substantial fall in income due to a serious economic recession.
A) Graph A
B) Graph B
C) Graph C
D) Graph D
F) A) and D)
Correct Answer

verified
Correct Answer
verified
Multiple Choice
Which of the following is consistent with the law of demand?
A) A decrease in the price of tacos causes sellers to want to sell less
B) An increase in the people's craving for pizza causes buyers to buy more pizza
C) An increase in the price of hamburgers causes buyers to buy fewer hamburgers
D) A decrease in the price of egg rolls causes a decrease in the quantity of egg rolls demanded
F) None of the above
Correct Answer

verified
Correct Answer
verified
Multiple Choice
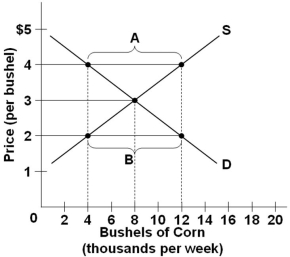 Refer to the above diagram of the market for corn. If the price in this market is at $4 per bushel, then there will be a:
A) Surplus and the price will tend to rise
B) Shortage and the price will tend to rise
C) Surplus and the price will tend to fall
D) Shortage and the price will tend to fall
F) B) and C)
Correct Answer

verified
Correct Answer
verified
Multiple Choice
Which of the following is a determinant of supply?
A) Tastes and preferences
B) Price of a complementary good
C) Consumer income
D) Product taxes and subsidies
F) A) and C)
Correct Answer

verified
Correct Answer
verified
Multiple Choice
In order to derive a market demand curve from individuals' demand curves, we add up the:
A) Various individuals' quantities demanded at each price level
B) Various prices that each buyer is willing and able to pay
C) Incomes of all buyers, assuming that their tastes remain constant
D) Total number of buyers in the market at each time period
F) A) and D)
Correct Answer

verified
Correct Answer
verified
Multiple Choice
In the diagrams below, the subscript "1" refers to the initial position of the curve, while the subscript "2" refers to the final position after the curve shifts. 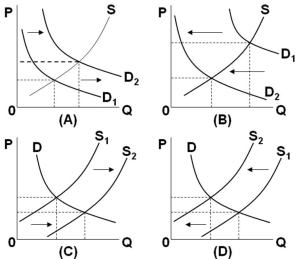 Refer to the diagrams above. In which of them would we see a shortage at the initial price after the indicated curve has shifted?
A) A and D
B) B and D
C) B and C
D) A and C
F) B) and C)
Correct Answer

verified
Correct Answer
verified
Multiple Choice
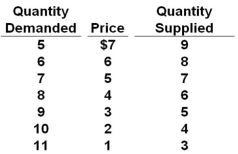 Refer to the above table. If demand decreased by 4 units at each price and supply decreased by 2 units at each price, what would the new equilibrium price and quantity be?
A) $3 and 5 units
B) $4 and 4 units
C) $5 and 5 units
D) $6 and 6 units
F) C) and D)
Correct Answer

verified
Correct Answer
verified
Multiple Choice
As a result of a decrease in the price of online streaming movies, consumers download more movies online and buy fewer DVDs. This is an illustration of:
A) Consumer sovereignty
B) The income effect
C) The substitution effect
D) Diminishing marginal utility
F) A) and D)
Correct Answer

verified
Correct Answer
verified
Multiple Choice
Which of the following is an example of a price ceiling?
A) Limits on interest rates charged by credit card companies
B) Subsidies for apartment rent in major cities
C) Minimum-wage laws for unskilled workers
D) Price supports for agricultural products
F) B) and D)
Correct Answer

verified
Correct Answer
verified
Showing 41 - 60 of 202
Related Exams