A) is the best way to analyze a policy.
B) leads to the best solutions.
C) is the only way to analyze a policy.
D) examines if the policy actually accomplished its goals.
F) B) and D)
Correct Answer

verified
Correct Answer
verified
Multiple Choice
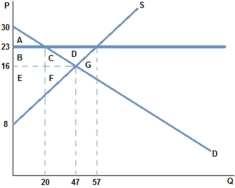 The graph shown best represents:
A) a non-binding price ceiling.
B) a non-binding price floor.
C) a missing market.
D) a market for an inferior good.
F) A) and D)
Correct Answer

verified
Correct Answer
verified
Multiple Choice
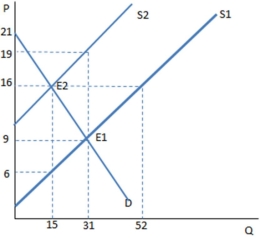 Suppose a tax has been imposed in the graph shown. Which kind of tax is most likely demonstrated by this graph?
A) A tax on sellers
B) A tax on buyers
C) A tax on big corporations
D) A price ceiling
F) B) and D)
Correct Answer

verified
Correct Answer
verified
Multiple Choice
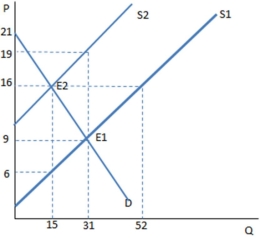 Suppose a tax on sellers has been imposed as shown in the graph. Once the tax is in place, the buyers experience:
A) a decrease in demand.
B) an increase in demand.
C) a decrease in quantity demanded.
D) an increase in quantity demanded.
F) All of the above
Correct Answer

verified
Correct Answer
verified
Multiple Choice
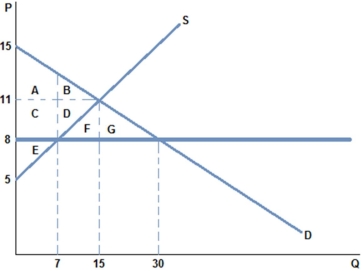 If a price ceiling of $8 were placed in the market in the graph shown:
A) some surplus is transferred from consumer to producer.
B) some surplus is transferred from producer to consumer.
C) all consumers are made better off.
D) all producers are made better off.
F) B) and C)
Correct Answer

verified
Correct Answer
verified
Multiple Choice
Price controls:
A) are regulations that sets a maximum or minimum legal price for a particular good.
B) allow a market to reach equilibrium.
C) prevent a good from being bought or sold.
D) All of these are true.
F) A) and D)
Correct Answer

verified
Correct Answer
verified
Multiple Choice
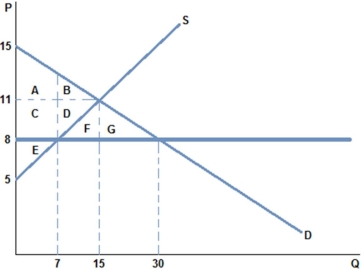 According to the graph above, a price ceiling in this market would be non-binding if it were set at:
A) $5.
B) $8.
C) $10.
D) $13.
F) C) and D)
Correct Answer

verified
Correct Answer
verified
Multiple Choice
Would you expect a tax on cigarettes to be more effective at discouraging consumption over the long run or the short run?
A) Long run because demand becomes more elastic over time
B) Long run because demand becomes less elastic over time
C) Short run because demand becomes more elastic over time
D) Short run because demand becomes less elastic over time
F) None of the above
Correct Answer

verified
Correct Answer
verified
Multiple Choice
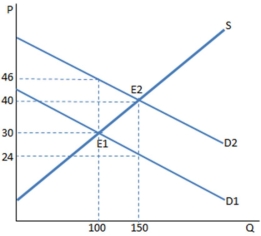 A subsidy to buyers has been placed in the market in the graph shown. The result is:
A) a higher quantity bought and sold at a higher price.
B) customers are worse off than before the subsidy.
C) producers are worse off than before the subsidy.
D) None of these is true.
F) B) and C)
Correct Answer

verified
Correct Answer
verified
Multiple Choice
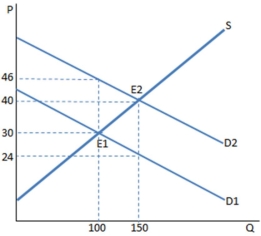 The graph shown portrays a subsidy to buyers. The amount of money spent on this subsidy by the government is:
A) $3,600.
B) $2,400.
C) $6,000.
D) $800.
F) C) and D)
Correct Answer

verified
Correct Answer
verified
Multiple Choice
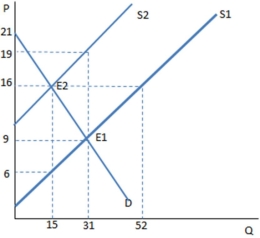 The graph shown demonstrates a tax on sellers. Which of the following can be said about the effect of this tax?
A) The tax creates a shortage, and rationing must occur.
B) The tax creates a surplus, and the government must buy the excess.
C) The tax creates a shortage, and the government must regulate the market.
D) None of these is true.
F) C) and D)
Correct Answer

verified
Correct Answer
verified
Multiple Choice
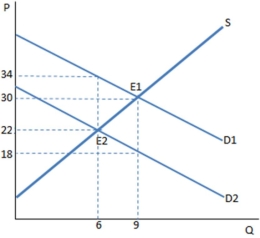 The graph shown demonstrates a tax on buyers. Which of the following can be said about the effect of this tax?
A) The price paid by buyers is greater than that received by sellers, and the difference is the tax wedge.
B) The price paid by buyers is less than that received by sellers, and the difference is the total tax revenue.
C) The price paid by buyers is greater than that received by sellers, and the difference is the total tax revenue.
D) The price paid by buyers and received by sellers is higher than it was before the tax was imposed.
F) All of the above
Correct Answer

verified
Correct Answer
verified
Multiple Choice
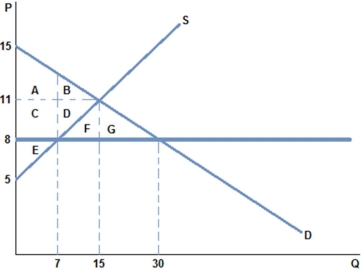 The graph shown best represents:
A) a binding price ceiling.
B) a binding price floor.
C) a missing market.
D) a market for an inferior good.
F) B) and C)
Correct Answer

verified
Correct Answer
verified
Multiple Choice
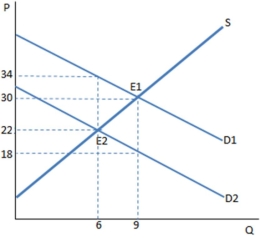 The graph shown demonstrates a tax on buyers. Before the tax was imposed, the buyers purchased ____ units and paid _____ for each one.
A) 6; $22
B) 6; $34
C) 9; $18
D) 9; $30
F) B) and C)
Correct Answer

verified
Correct Answer
verified
Multiple Choice
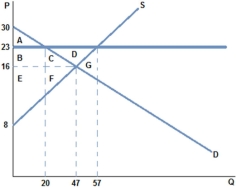 If a price floor of $23 were placed in the market in the graph shown:
A) some surplus is transferred from consumer to producer.
B) some surplus is transferred from producer to consumer.
C) all producers are better off.
D) all consumers are better off.
F) A) and B)
Correct Answer

verified
Correct Answer
verified
Multiple Choice
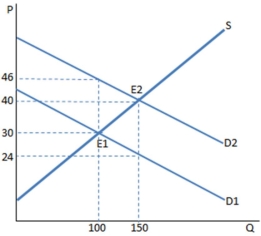 Assume a subsidy to buyers has been enacted in the market in the graph shown. With the subsidy, the producers sell _____ units and receive _____ for each of them.
A) 100; $46
B) 100; $30
C) 150; $40
D) 150; $24
F) B) and D)
Correct Answer

verified
Correct Answer
verified
Multiple Choice
Because a price floor causes:
A) a shortage, some form of rationing must occur.
B) a surplus, some producers may ultimately lose because they won't have enough customers.
C) a shortage, rent-seeking will occur.
D) a surplus, everyone will be better off.
F) None of the above
Correct Answer

verified
Correct Answer
verified
Multiple Choice
If the demand curve is more elastic than the supply curve, then:
A) the buyers will bear a greater tax incidence than sellers.
B) the sellers will bear a greater tax incidence than buyers.
C) tax incidence will be shared equally by buyer and seller.
D) None of these is true.
F) A) and C)
Correct Answer

verified
Correct Answer
verified
Multiple Choice
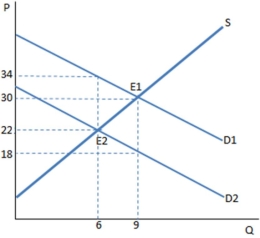 The graph shown demonstrates a tax on buyers. Which of the following can be said about the effect of this tax?
A) The tax creates a shortage, and rationing must occur.
B) The tax creates a surplus, and the government must buy the excess.
C) The tax creates a shortage, and the government must regulate the market.
D) None of these is true.
F) A) and C)
Correct Answer

verified
Correct Answer
verified
Multiple Choice
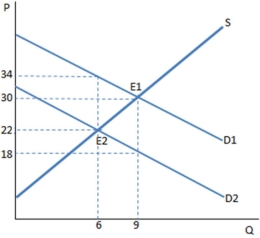 Suppose a tax on buyers has been imposed in the graph shown. Once the tax is in place, the sellers experience:
A) a decrease in supply.
B) an increase in supply.
C) a decrease in quantity supplied.
D) an increase in quantity supplied.
F) A) and D)
Correct Answer

verified
Correct Answer
verified
Showing 21 - 40 of 154
Related Exams